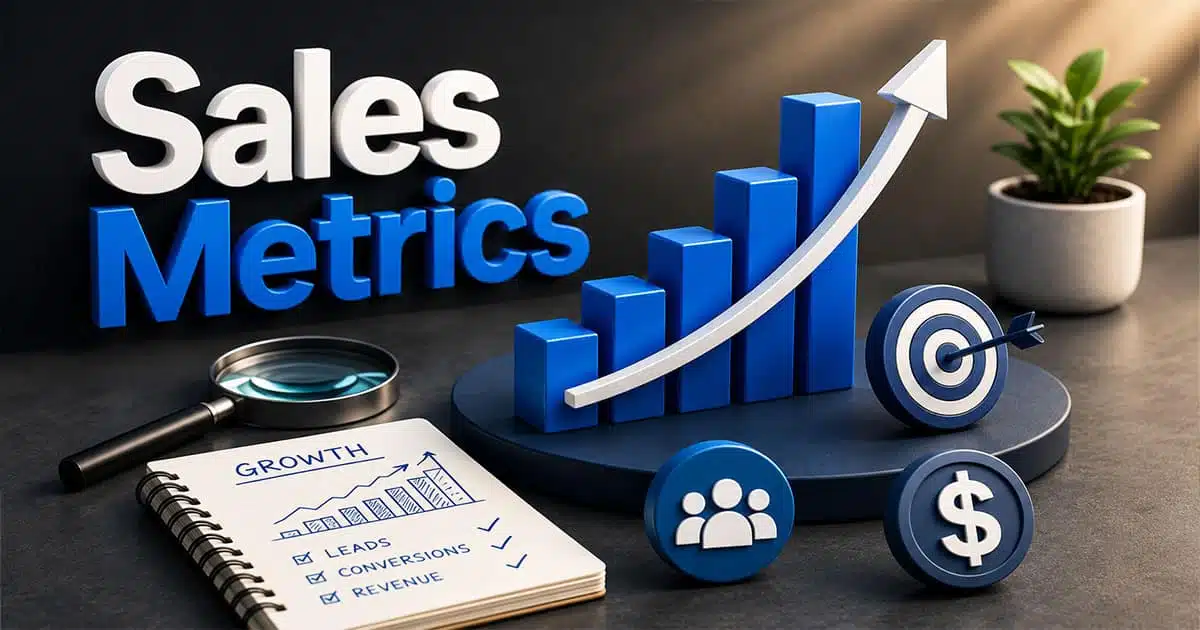
Sales teams collect a huge amount of data every day. Calls, emails, meetings, conversions, and closed deals all create numbers. But raw data means nothing without the right sales metrics. Strong metrics help businesses understand what works, what fails, and where revenue opportunities exist.
Many companies focus only on revenue and miss the bigger picture. Sales metrics show the real story behind pipeline health, team performance, customer behavior, and conversion efficiency. They also help sales leaders make faster and smarter decisions.
A clear sales metrics strategy can improve forecasting, boost productivity, and increase revenue over time. Businesses that track the right numbers often build stronger and more predictable sales growth.
What Are Sales Metrics
Sales metrics are measurable data points that show how a company’s sales process performs. Businesses use sales metrics to track sales revenue, sales productivity, customer satisfaction, and team performance. Sales teams and sales managers rely on those numbers to understand what drives growth and where problems exist. Metrics also help sales leaders improve sales strategies and make better decisions across sales operations.
Key sales metrics can cover many areas of the sales funnel. Common examples include conversion rate, win rate, customer acquisition cost CAC, average deal size, and sales cycle length. Many companies also track monthly recurring revenue MRR, annual recurring revenue ARR, customer lifetime value CLV, and total sales revenue. Those metrics measure both short-term and long-term sales effectiveness.
Tracking sales metrics helps businesses improve resource allocation, customer retention, and sales process efficiency. The right sales metrics also reveal how sales reps perform and how qualified leads move through the sales pipeline.
Difference Between Sales Metrics And Sales KPIs
Sales metrics and sales KPIs are closely connected, but they are not the same. Sales metrics track different data points across the sales process, while sales KPIs focus on the most important goals tied to business growth and sales performance.
Aspect | Sales Metrics | Sales KPIs |
|---|---|---|
Definition | General data points that measure sales activities and performance | Strategic key performance indicators tied to business goals |
Purpose | Track daily, weekly, or monthly sales data | Measure progress toward major sales targets |
Focus Area | Broad sales operations and sales process tracking | Critical business outcomes and growth |
Examples | Sales calls, conversion rate, average deal size | Monthly recurring revenue MRR, win rate, total sales revenue |
Usage | Used by sales reps and sales managers for analysis | Used by sales leaders for strategic decisions |
Scope | Covers many performance areas | Focuses only on the most important sales metrics |
Measurement Type | Can include leading and lagging indicators | Usually tied to high-priority lagging indicators |
Business Impact | Helps improve sales productivity and efficiency | Helps measure company’s sales success |
Sales Performance Metrics That Measure Revenue Growth
Sales performance metrics help businesses understand how well sales teams generate revenue and close deals. Strong metrics reveal gaps in the sales process and improve decision-making. Companies that track the right sales data often improve forecasting, customer retention, and overall sales effectiveness.
Revenue Growth Rate
Revenue growth rate shows how fast a company’s sales revenue increases over time. Sales leaders use this metric to measure business growth and market demand. A healthy growth rate often reflects strong sales strategies and better customer relationships.
Recent reports show high-performing SaaS companies maintain annual recurring revenue ARR growth above 30%. Businesses with stable growth usually have better sales process efficiency and stronger sales team performance. This metric also helps with resource allocation and future planning.
Win Rate
Win rate measures how many qualified leads turn into closed deals. Sales managers use this metric to evaluate sales reps and sales activities. A low win rate may point to poor lead quality or weak sales communication.
Research from HubSpot shows the average B2B sales win rate stays around 21%. Top sales teams often achieve much higher results through better follow-ups and stronger sales funnel management. A higher win rate usually leads to more revenue generated and improved total sales revenue.
Average Deal Size
Average deal size tracks the average revenue per closed deal. This metric helps businesses understand customer value and sales opportunities. Companies with larger deal sizes often generate stronger cash flow and higher profits.
Sales analytics platforms show many B2B companies increased average deal value by focusing on enterprise clients and upselling. Sales representatives also use this metric to identify high-value accounts. Better deal sizes can improve total revenue without increasing the number of deals.
Sales Cycle Length
Sales cycle length measures how long sales reps take to close a deal. Shorter sales cycles often improve sales productivity and revenue growth. Long cycles may slow cash flow and reduce team performance.
Recent industry data suggests the average sales cycle length in B2B SaaS ranges from two to six months. Sales tools and automation now help teams speed up communication and lead qualification. Faster sales cycles usually improve customer satisfaction and sales team's success.
Customer Lifetime Value
Customer lifetime value measures the total revenue a business expects from a customer relationship. Sales leaders track this metric to understand long-term profitability and customer retention. A higher customer lifetime value often supports stronger business growth.
Studies show businesses with strong customer retention strategies can increase profits by up to 25% or more. Customer lifetime value CLV also helps companies compare customer acquisition cost CAC with long-term revenue. This balance is one of the most important sales metrics for sustainable growth.
Pipeline Metrics That Help Track Sales Opportunities
Pipeline metrics help sales teams understand how deals move through the sales funnel. Strong pipeline tracking reveals weak spots, stalled opportunities, and future revenue potential. Sales managers use those metrics to improve forecasting, sales process efficiency, and overall sales performance.
Pipeline Value
Pipeline value measures the total potential revenue inside the sales pipeline. Sales leaders use this metric to estimate future sales revenue and business growth. A healthy pipeline usually shows strong lead generation and consistent sales activities.
Recent sales reports show companies with accurate pipeline tracking improve forecast accuracy by over 25%. Sales teams also use pipeline value to prioritize high-value opportunities. Better visibility into pipeline data helps improve resource allocation and total revenue planning.
Lead Conversion Rate
Lead conversion rate tracks how many potential customers become paying customers. This metric measures sales effectiveness across the sales funnel. A low conversion rate may signal poor lead quality or weak follow-up strategies.
HubSpot data shows the average B2B lead conversion rate stays between 2% and 5% across industries. High-performing sales reps often exceed those numbers with personalized outreach and faster response times. Better conversion rates usually increase revenue generated without increasing marketing costs.
Pipeline Coverage Ratio
Pipeline coverage ratio compares the total pipeline value with upcoming sales targets. Sales managers use this metric to understand whether enough opportunities exist to hit revenue goals. A weak ratio may create forecasting risks.
Many sales leaders follow a 3:1 pipeline coverage benchmark. That means a company needs three times more pipeline value than its sales quota. Strong pipeline coverage often supports stable cash flow and better sales team performance over time.
Opportunity Win Rate
Opportunity win rate measures how many sales opportunities turn into closed deals. This metric helps businesses evaluate sales strategies and sales reps performance. Higher win rates usually reflect stronger customer relationships and better qualification processes.
Recent research from Salesforce found top performing sales teams close nearly 30% of qualified opportunities. Sales analytics tools also help identify patterns behind successful deals. Better opportunity management often improves average deal size and annual recurring revenue ARR.
Pipeline Velocity
Pipeline velocity measures how quickly deals move through the sales cycle. Faster movement often leads to higher sales productivity and quicker revenue growth. Slow pipeline velocity may reveal problems inside the sales process.
Industry data shows businesses with shorter average sales cycle length often achieve higher customer satisfaction and better team performance. Sales tools and automation platforms now help reduce delays across pipeline stages. Faster pipeline movement also improves monthly recurring revenue MRR and overall sales operations efficiency.
Sales Conversion Rate And Funnel Efficiency
Sales conversion metrics show how effectively businesses turn leads into paying customers. Funnel efficiency reveals how smoothly prospects move through the sales process. Strong conversion data helps sales teams improve customer acquisition, sales productivity, and total sales revenue.
Lead To Customer Rate
Lead-to-customer rate measures how many qualified leads become actual customers. Sales managers use this metric to evaluate sales effectiveness across the sales funnel. A strong conversion rate often reflects better lead qualification and stronger sales strategies.
Recent studies show the average B2B lead-to-customer conversion rate ranges between 2% and 7%. Top sales teams usually achieve higher numbers through personalized communication and faster follow-ups. Better conversion rates also improve sales revenue without increasing customer acquisition cost CAC.
Sales Funnel Drop Off
Sales funnel drop-off tracks where potential customers leave the sales process. This metric helps sales leaders identify weak stages inside the sales pipeline. Large drop-offs often reduce total sales and hurt team performance.
HubSpot reports that many businesses lose over 60% of leads between the first contact and proposal stage. Sales analytics tools now help companies track customer behavior more accurately. Better funnel analysis improves customer relationships and sales process efficiency.
Demo To Close Rate
Demo to close rate measures how many product demos convert into closed deals. This metric is important for SaaS companies and high-value B2B sales teams. A higher close rate usually points to strong product value and better sales reps performance.
Recent SaaS data suggests average demo conversion rates stay around 20% to 25%. Sales representatives with strong product knowledge often close deals faster and improve average deal value. Better demo performance can also increase monthly recurring revenue MRR and annual recurring revenue ARR.
Cart Or Proposal Conversion
Cart or proposal conversion measures how many buyers accept a proposal or complete a purchase. Businesses use this metric to understand decision-stage behavior inside the sales cycle. Low conversion numbers may signal pricing or trust issues.
Research shows nearly 70% of online shopping carts are abandoned before checkout. In B2B sales, proposal acceptance rates often remain below 40%. Better follow-ups, simpler pricing, and faster communication usually improve conversion rates and customer satisfaction.
Funnel Velocity
Funnel velocity measures how quickly leads move through different funnel stages. Faster movement often improves cash flow and overall sales performance. Slow funnel velocity may indicate weak sales activities or poor qualification processes.
Recent sales reports show companies with shorter average sales cycle length often achieve higher revenue growth. Sales tools and automation platforms help reduce delays across the funnel. Faster funnel movement also improves sales team's success and increases revenue generated over time.
Sales Activity Metrics That Measure Team Productivity
Sales activity metrics help businesses measure how effectively sales teams use their time and effort. Those metrics reveal daily performance patterns, sales process gaps, and productivity levels. Sales managers rely on activity data to improve sales effectiveness and support revenue growth.
Sales Calls Per Rep
Sales calls per rep measure how many calls sales representatives complete within a specific period. This metric helps sales managers track daily sales activities and individual performance. Strong call volume often supports better lead engagement and pipeline growth.
Recent sales research shows top sales reps make around 35 to 50 outbound calls daily. However, quality matters more than volume alone. Personalized conversations and better follow-ups usually improve conversion rate and customer relationships. Balanced sales activity metrics often lead to stronger sales team performance.
Email Response Rate
Email response rate measures how many prospects reply to sales emails. This metric helps businesses evaluate outreach quality and communication effectiveness. Low response rates may point to poor messaging or weak audience targeting.
Industry reports show the average B2B sales email response rate stays between 8% and 15%. Sales leaders often improve those numbers through shorter emails and personalized subject lines. Better response rates can increase qualified leads and improve sales pipeline performance over time.
Meetings Booked
Meetings booked track how many successful appointments sales reps schedule with potential customers. This metric reflects prospect interest and sales process efficiency. More meetings often create stronger sales opportunities and higher revenue potential.
Recent data from Salesforce shows high-performing sales teams book more qualified meetings through multichannel outreach. Sales tools and automation also help reps reduce manual tasks and improve sales productivity. Strong meeting activity usually supports faster sales cycle movement and higher win rates.
Follow-Up Speed
Follow-up speed measures how quickly sales reps respond to leads after first contact. Fast response times often improve customer satisfaction and conversion rates. Delayed follow-ups can reduce sales effectiveness and lead quality.
Research from Lead Connect found businesses that respond within five minutes are far more likely to qualify leads successfully. Sales operations teams now use automation to improve response speed across the sales funnel. Faster follow-ups also help improve customer acquisition and total sales revenue.
Tasks Completed
Tasks completed measure how efficiently sales teams handle daily responsibilities. This metric includes calls, emails, demos, proposals, and CRM updates. Sales managers use this data to evaluate team productivity and resource allocation.
Recent workplace studies show sales reps spend nearly 30% of their time on administrative work instead of selling. Modern sales tools now automate repetitive tasks and improve sales productivity. Better task management often supports stronger sales performance metrics and long-term business growth.
Lead Generation Metrics For Better Sales Results
Lead generation metrics help businesses measure how effectively they attract and convert potential customers. Strong lead data improves sales strategies, customer acquisition, and pipeline growth. Sales teams use those metrics to focus on high-quality leads and better revenue opportunities.
Cost Per Lead
Cost per lead measures how much a business spends to generate one lead. Sales managers and marketing teams use this metric to evaluate campaign efficiency and resource allocation. Lower costs often improve profitability and customer acquisition performance.
Recent reports show the average B2B cost per lead ranges from $40 to over $200 depending on the industry. Businesses with targeted campaigns and better audience segmentation usually reduce lead costs significantly. Strong lead quality also helps improve conversion rate and total sales revenue.
Lead Qualification Rate
Lead qualification rate tracks how many leads meet the company’s sales criteria. This metric helps sales teams focus on prospects with higher buying intent. Poor qualification can waste time and reduce sales productivity.
HubSpot data suggests nearly 61% of marketers struggle to generate high quality leads consistently. Sales reps often improve qualification rates through better customer data and personalized outreach. Higher quality leads usually move faster through the sales funnel and increase win rate performance.
Lead Source Performance
Lead source performance measures which channels generate the best sales opportunities. Businesses track sources like email campaigns, search traffic, referrals, and social media. This metric helps sales leaders improve sales operations and budget planning.
Recent studies show organic search and referrals often produce higher conversion rates than paid advertising. Sales analytics tools also help companies compare lead quality across channels. Better source tracking improves sales process efficiency and increases revenue generated over time.
Lead Response Time
Lead response time measures how quickly sales representatives contact new leads. Faster responses often improve customer relationships and sales effectiveness. Slow replies may reduce trust and lower conversion opportunities.
Research from InsideSales found companies that respond within five minutes are much more likely to convert leads successfully. Sales tools and automation platforms now help businesses improve response speed. Faster engagement also supports better customer satisfaction and shorter sales cycle length.
Marketing Qualified Leads
Marketing qualified leads measure how many prospects show strong interest before entering the sales pipeline. Sales and marketing teams use this metric to align sales strategies and improve lead nurturing. Strong MQL performance often supports better sales team performance.
Recent industry data shows businesses with aligned sales and marketing teams achieve higher annual recurring revenue ARR growth. Better MQL tracking also helps reduce customer acquisition cost CAC and improve average deal size. Strong lead nurturing creates more qualified leads and healthier pipeline growth.
Customer Acquisition Cost And Customer Lifetime Value
Customer acquisition cost and customer lifetime value are two of the most important sales metrics for business growth. Those numbers show how much a company spends to gain customers and how much revenue each customer generates over time. Strong balance between both metrics improves profitability and long-term sales performance.
Customer Acquisition Cost
Customer acquisition cost CAC measures how much a business spends to acquire one new customer. This metric includes sales activities, advertising costs, sales tools, and marketing expenses. Sales leaders use CAC to measure sales process efficiency and budget performance.
Recent reports show average customer acquisition cost increased across many industries due to rising advertising costs. SaaS businesses now spend hundreds or even thousands of dollars to acquire enterprise customers. Lower acquisition costs often improve cash flow and support healthier revenue growth.
Customer Lifetime Value
Customer lifetime value measures the total revenue a business expects from a customer relationship. This metric helps companies understand long-term profitability and customer retention strength. Higher customer lifetime value usually supports stronger business stability.
Research shows increasing customer retention by just 5% can boost profits by up to 25% or more. Businesses with loyal existing customers often generate higher annual recurring revenue ARR and monthly recurring revenue MRR. Strong customer relationships also improve average customer lifespan and repeat purchases.
CAC To CLV Ratio
CAC to CLV ratio compares customer acquisition cost with customer lifetime value. Sales managers use this metric to understand whether customer acquisition efforts remain profitable. Healthy ratios often reflect strong sales strategies and efficient resource allocation.
Most experts recommend a 3:1 customer lifetime value to CAC ratio for sustainable growth. A weak ratio may signal high acquisition costs or poor customer retention. Sales analytics platforms now help businesses monitor profitability across different customer segments and sales channels.
Payback Period
Payback period measures how long a company takes to recover customer acquisition costs. Shorter payback periods often improve cash flow and financial stability. Long recovery times may create pressure on sales operations and growth plans.
Recent SaaS benchmarks show many companies target a CAC payback period below 12 months. Businesses with faster revenue recovery usually have stronger sales funnel performance and better conversion rates. Efficient onboarding and upselling also help improve overall sales revenue.
Retention Revenue
Retention revenue measures income generated from existing customers over time. This metric helps businesses track customer satisfaction, loyalty, and long-term sales effectiveness. Strong retention often reduces pressure on new customer acquisition.
Industry studies show repeat customers spend significantly more than first-time buyers. Existing customers also cost less to maintain compared to acquiring new leads. Better retention revenue usually improves total sales revenue, customer lifetime value CLV, and overall company's sales performance.
Sales Velocity And Average Deal Size Metrics
Sales velocity and average deal size metrics help businesses measure how quickly revenue moves through the sales pipeline. Those metrics reveal sales process efficiency, team productivity, and growth potential. Sales leaders use them to improve forecasting, conversion rates, and overall sales performance.
Sales Velocity
Sales velocity measures how quickly sales teams generate revenue from qualified leads. This metric combines deal value, win rate, sales cycle length, and number of opportunities. Faster sales velocity often supports stronger cash flow and revenue growth.
Recent industry benchmarks show top B2B companies shorten sales cycles through automation and better lead qualification. Sales analytics tools also help identify delays across the sales funnel. Better sales velocity usually improves monthly recurring revenue MRR and overall sales effectiveness.
Average Deal Size
Average deal size tracks the average revenue generated from each closed deal. Sales managers use this metric to measure customer value and sales opportunities. Larger deal sizes often increase profitability without increasing lead volume.
Recent SaaS data shows enterprise-focused companies continue to raise average deal value through upselling and premium services. Sales representatives also use deal size data to target higher-value accounts. Strong average deal size often improves annual recurring revenue ARR and total sales revenue.
Revenue Per Customer
Revenue per customer measures the average revenue each customer generates during a specific period. This metric helps businesses evaluate customer relationships and pricing strategies. Higher revenue per customer often supports better profitability and customer lifetime value CLV.
Research shows companies with personalized upselling strategies generate higher average revenue per account. Existing customers also tend to spend more over time compared to new buyers. Better customer retention usually improves long-term sales revenue and business stability.
Sales Cycle Speed
Sales cycle speed measures how quickly sales reps close deals after first contact. Faster sales cycles improve sales productivity and reduce pipeline delays. Long cycles may slow revenue generated and affect team performance.
Recent reports suggest the average sales cycle length increased in complex B2B industries due to longer decision processes. Sales tools and automation now help businesses reduce manual tasks and improve communication. Better cycle speed often increases conversion rate and overall sales operations efficiency.
Deal Expansion Rate
Deal expansion rate measures how often customers upgrade or expand their purchases after the first deal. This metric reflects customer satisfaction and sales team success. Strong expansion rates often improve customer lifetime value and recurring revenue.
Industry studies show upselling existing customers remains more cost-effective than acquiring new leads. Businesses with strong customer relationships usually generate higher expansion revenue over time. Better expansion strategies also improve total revenue and reduce customer acquisition cost CAC.
Sales Forecasting Metrics For Better Business Planning
Sales forecasting metrics help businesses predict future revenue and plan resources more effectively. Accurate forecasting improves sales operations, budgeting, and growth strategies. Sales leaders use forecasting data to reduce risks, improve decision-making, and support long-term business stability.
Forecast Accuracy
Forecast accuracy measures how close predicted sales revenue is to actual results. This metric helps sales managers evaluate planning quality and sales process reliability. Poor accuracy often creates budgeting and resource allocation problems.
Recent studies show many companies still miss revenue forecasts by more than 20%. Businesses with strong CRM systems and better sales analytics usually improve forecasting performance significantly. Accurate forecasting also helps companies manage cash flow and sales targets more effectively.
Pipeline Forecast Value
Pipeline forecast value estimates future revenue based on current sales opportunities. Sales teams use this metric to understand expected deal flow and revenue potential. A healthy pipeline forecast often supports better sales planning.
Industry reports show companies with strong pipeline visibility achieve more stable annual recurring revenue ARR growth. Sales leaders also rely on forecast data to prioritize qualified leads and sales activities. Better pipeline forecasting improves overall sales effectiveness and team performance.
Quota Attainment Rate
Quota attainment rate measures how often sales reps reach their sales targets. This metric helps businesses evaluate individual and team performance. Low quota attainment may signal weak lead quality or unrealistic goals.
Recent Salesforce research found only about half of sales representatives consistently hit quota targets. Sales managers often improve results through better coaching and sales tools. Higher quota attainment usually increases total sales revenue and improves sales team's success.
Recurring Revenue Forecast
Recurring revenue forecast predicts future monthly recurring revenue MRR and annual recurring revenue ARR from existing customers. This metric is especially important for SaaS and subscription-based businesses. Predictable revenue helps companies plan long-term growth.
Recent SaaS benchmarks show businesses with strong customer retention maintain more stable recurring revenue streams. Sales analytics platforms now help companies track churn risks and renewal opportunities more accurately. Better forecasting also improves customer lifetime value CLV and financial stability.
Deal Probability Rate
Deal probability rate estimates the likelihood of closing active opportunities inside the sales pipeline. Sales managers use this metric to prioritize high-value deals and forecast future sales revenue. Accurate probability tracking improves planning and sales operations efficiency.
Research shows businesses that use AI-powered forecasting tools often improve prediction accuracy by over 30%. Sales reps also benefit from better visibility into deal risks and customer behavior. Strong probability analysis supports smarter sales strategies and faster decision-making.
Best Tools And Dashboards For Tracking Sales Metrics
Sales tools and dashboards help businesses monitor sales metrics, pipeline activity, and revenue performance in real time. Modern platforms improve sales analytics, forecasting, and reporting accuracy. Sales teams use those tools to track progress, improve productivity, and make faster decisions.
CRM Platforms
CRM platforms help businesses manage customer relationships, sales pipelines, and sales activities from one place. Sales managers use CRM dashboards to track conversion rate, sales revenue, and team performance. Strong CRM systems improve visibility across the sales process.
Recent industry data shows over 90% of businesses now use CRM software to support sales operations. Platforms like Gain.io help sales reps automate tasks and improve follow-ups. Better CRM usage often increases customer satisfaction and sales effectiveness.
Sales Analytics Tools
Sales analytics tools help businesses analyze sales data, forecast trends, and measure key sales metrics. Those platforms turn raw data points into clear reports and actionable insights. Sales leaders rely on analytics dashboards for smarter decision-making.
Recent reports show companies that use advanced sales analytics improve forecast accuracy and revenue growth more consistently. Tools like Gain.io help teams visualize total sales revenue and customer behavior. Strong analytics also improve sales strategies and resource allocation.
Pipeline Management Tools
Pipeline management tools help sales teams track deals through every stage of the sales funnel. Those dashboards improve visibility into qualified leads, opportunity status, and sales cycle length. Better pipeline tracking supports stronger forecasting and faster deal movement.
Research shows businesses with organized pipeline management often achieve higher win rates and better sales productivity. Platforms like Gain.io CRM help sales representatives manage daily sales activities more efficiently. Strong pipeline visibility also improves cash flow planning.
Revenue Intelligence Platforms
Revenue intelligence platforms combine AI, sales analytics, and customer data to improve forecasting and sales performance. Those tools help businesses identify revenue opportunities and customer risks earlier. Sales leaders use them to improve sales process efficiency.
Recent market reports show AI-powered sales tools continue to grow rapidly across B2B industries. Platforms like Gain.io analyze sales calls, pipeline activity, and deal progress automatically. Better revenue intelligence often improves annual recurring revenue ARR and customer retention.
Custom Sales Dashboards
Custom sales dashboards allow businesses to track specific sales metrics based on company goals. Teams can monitor conversion rate, average deal size, monthly recurring revenue MRR, and quota attainment in one view. Clear dashboards improve team alignment and reporting speed.
Recent workplace studies show employees make faster decisions when data appears in visual dashboard formats. Many companies now build dashboards through CRM integrations and business intelligence tools. Better dashboard visibility also improves individual and team performance across sales operations.
Common Mistakes Businesses Make When Tracking Sales Metrics
Many businesses collect large amounts of sales data but still struggle to improve performance. Poor tracking habits often create confusion, weak forecasting, and inaccurate reporting. Sales leaders must focus on the right sales metrics to support smarter decisions and long-term growth.
Too Many Metrics
Too many metrics can overwhelm sales teams and reduce focus. Businesses often track every possible data point without identifying the most important sales metrics. This creates confusion across sales operations and reporting.
Recent workplace studies show employees perform better with fewer and clearer key performance indicators. Sales managers should prioritize metrics tied directly to sales revenue, conversion rate, and customer retention. Simpler reporting often improves sales productivity and team performance.
Wrong Data Sources
Wrong data sources can create inaccurate sales analytics and poor forecasting. Businesses sometimes rely on outdated CRM records or incomplete customer data. Weak data quality often affects sales process efficiency and decision-making.
Research shows poor data management costs businesses millions each year through reporting errors and lost opportunities. Sales tools with real-time updates help improve sales data accuracy. Better data quality also supports stronger customer relationships and forecasting performance.
Focus Only On Revenue
Many companies focus only on total sales revenue while ignoring leading indicators. Revenue matters, but it does not explain why sales performance improves or declines. Businesses need balanced tracking across the entire sales funnel.
Sales leaders often monitor metrics like win rate, sales cycle length, and qualified leads alongside revenue generated. Recent reports show businesses with broader sales analytics achieve more accurate forecasting. Better metric balance also improves resource allocation and long-term sales effectiveness.
Poor Team Alignment
Poor alignment between sales teams and leadership can weaken metric tracking. Sales reps may focus on daily sales activities while managers prioritize revenue goals. Misalignment often creates inconsistent reporting and unclear sales targets.
Recent surveys show companies with aligned sales operations achieve higher quota attainment and customer satisfaction. Clear communication around sales KPIs helps improve individual and team performance. Shared goals also support stronger sales strategies and healthier pipeline growth.
No Regular Reviews
Many businesses collect sales metrics but fail to review them consistently. Without regular analysis, problems inside the sales process may go unnoticed for months. Delayed action often hurts conversion rate and customer acquisition performance.
Industry research shows companies that review sales metrics weekly often respond faster to pipeline risks and market changes. Sales dashboards and automated reports now simplify performance tracking. Frequent reviews also help sales managers improve coaching and sales team's success.
How Gain.io Helps Businesses Track And Improve Sales Metrics
Gain.io helps businesses track sales metrics with better visibility and real-time sales analytics. Sales teams can monitor sales performance, pipeline activity, conversion rate, and revenue generated from one platform. Clear dashboards make it easier to understand sales data and improve sales process efficiency.
Sales managers and sales leaders can track key sales metrics like average deal size, sales cycle length, win rate, and customer acquisition cost CAC. The platform also helps businesses monitor monthly recurring revenue MRR, annual recurring revenue ARR, and customer lifetime value CLV. Better tracking supports smarter sales strategies and stronger forecasting.
Gain.io also improves collaboration across sales operations. Teams can align sales targets, improve customer relationships, and respond faster to pipeline changes. Strong visibility helps businesses improve customer retention, sales productivity, and overall sales effectiveness.
FAQs
Which Sales Metrics Matter Most For Small Businesses?
Small businesses should focus on key sales metrics like conversion rate, customer acquisition cost CAC, sales revenue, win rate, and sales cycle length. Those metrics help sales teams improve sales productivity, customer relationships, and overall sales performance without tracking too many data points.
Can Sales Metrics Improve Forecast Accuracy?
Yes, accurate sales metrics help businesses improve forecasting and resource allocation. Metrics like pipeline value, sales velocity, monthly recurring revenue MRR, and deal probability rate give sales leaders better visibility into future revenue and sales pipeline performance.
How Often Should Businesses Track Sales Metrics?
Most sales managers review important sales metrics weekly or monthly. Regular tracking helps businesses spot sales process issues, monitor team performance, and improve conversion rate before small problems affect total sales revenue and customer retention.
Do Sales Tools Help Improve Sales Performance?
Yes, modern sales tools and dashboards improve sales analytics, sales operations, and customer data tracking. Research shows businesses that use CRM systems often improve forecast accuracy and sales revenue through better visibility and automation.
Can AI Improve Sales Metrics Tracking?
Yes, AI-powered sales analytics tools help businesses track sales activities, qualified leads, and customer behavior more accurately. Recent studies show companies that use AI in sales often improve sales productivity, forecast accuracy, and conversion rates faster than manual tracking methods.