Sales KPIs can feel overwhelming at first. How many sales KPIs should a sales team really track? Modern sales teams often collect endless sales data but still miss revenue targets. More numbers do not mean better sales performance.
The right sales KPIs bring focus. Sales leaders and sales managers rely on key performance indicators KPIs to track progress across the sales pipeline. Metrics like customer acquisition cost CAC, customer lifetime value CLV, conversion rate, and average sales cycle length show what is working inside the sales process. Monthly sales growth, monthly recurring revenue, and closed deals reveal the real story behind sales revenue.
In this article, we will discuss clear KPIs for sales improve sales team performance, guide sales strategy, and drive consistent revenue growth across the entire sales team.
What Are Sales KPIs
Sales KPIs turn sales data into a clear direction. Key performance indicators KPIs show how sales performance connects to sales goals and revenue targets. Sales leaders and sales managers use sales KPIs to track progress across the sales process, sales pipeline, and sales funnel. Metrics like conversion rate, customer acquisition cost CAC, and customer lifetime value CLV reveal if sales efforts drive real revenue growth.
Sales metrics measure activity. Sales KPIs measure impact. Number of leads, number of deals, and sales activities are data points. Critical sales KPIs link those numbers to sales revenue, monthly sales growth, and total revenue. Modern sales teams rely on tracking sales KPIs to improve sales team performance, strengthen customer retention, and support consistent revenue growth across sales organizations.
How To Choose The Right Sales Performance Indicators
Choosing the right sales performance indicators starts with understanding what you want to achieve. Sales leaders who select sales KPIs without connecting them to business objectives end up tracking data that doesn't improve sales team performance or drive revenue growth.
Arrange KPIs With Your Revenue Goals
Your business objectives define which key performance indicators for sales matter most. Start by identifying your main goal. Are you focused on expanding market share, improving profitability with current resources, or accelerating customer acquisition? You can select relevant sales KPIs that track progress toward these outcomes once you establish this direction.
Work backward from your revenue operation targets to identify what needs to happen. Your monthly sales target becomes 100 sales if your annual revenue goal is 1,200 sales. Break this down further. How many deals must your sales team close monthly to hit that number? How many sales opportunities do you need in your sales pipeline to generate those closed deals? How many meetings with prospects does your entire sales team need each week to create those opportunities?
Select Measurable And Actionable Metrics
Not all sales metrics qualify as effective key performance indicators kpis. Your sales kpis to track must follow the SMART framework: Specific, Measurable, Achievable, Relevant and Time-bound.
Specific means you define metrics free from ambiguity. Rather than tracking "improve sales," define "increase monthly sales revenue by 15% in Q2 2026". Measurable requires quantifiable data you can collect with consistency. Achievable ensures your sales targets remain realistic given your resources and market conditions. Relevant metrics directly tie to your strategic goals. Time-bound indicators include defined evaluation periods.
Prioritize KPIs That Drive Decisions
Focus on five to seven metrics that reflect business health and guide decision-making with clarity. Spotting patterns and acting with the clarity your sales team needs becomes harder when everything feels urgent.
Each KPI should tell you what to do next if you're not meeting your goal. You should assess secondary metrics associated with that goal if you haven't hit your monthly sales bookings target. Check your lead to meeting conversion rate, average sales cycle length, or sales target attainment. You have an easier time getting to the root cause when you have metrics tied to each primary KPI that are defined with clarity.
Essential Sales KPIs Examples For Revenue Growth
Revenue growth depends on tracking the right financial and performance metrics. The following sales kpis examples provide clear visibility into your sales team performance and help sales leaders make analytical decisions about resource allocation and sales strategy.
Monthly Sales Growth And Bookings
Monthly sales growth measures how your sales revenue increases or decreases over a one-month period. You calculate it by subtracting sales from the previous month from current month sales, dividing by prior month sales, and multiplying by 100. To cite an instance, your monthly sales growth is 20% if you generated $120,000 this month compared to $100,000 last month.
Sales managers can uncover problems and remedy them fast with this metric. You can act right away when a dip occurs rather than waiting for quarterly reviews. Monthly sales growth also motivates your entire sales team by giving them goals to work toward in four-week sprints.
Average Profit Margin
Average profit margin measures your business's efficiency in converting sales into revenue. It represents the percentage of revenue that remains as company profit after accounting for all expenses and production costs. You calculate it by dividing net profit by total revenue and multiplying by 100.
Divide $50,000 by $500,000 to get 0.1, then multiply by 100 for a 10% average profit margin if your net profit minus costs of goods is $50,000 and total revenue is $500,000. A high profit margin of 10% or higher shows you generate profit from sales and operate well. A low profit margin below 5% may signal struggles with profitability due to high costs, low pricing, or operational inefficiencies.
Sales Target Attainment
Sales target attainment shows how individual sales reps, sales teams, or sales organizations performed against their quota for a set time period. You express it as a percentage by dividing actual sales by target sales and multiplying by 100. Their quota attainment for that quarter was 75% if a sales rep's quarterly quota was $100,000 and they generated $75,000.
Only 24.3% of salespeople exceed their yearly quota. 50% quota attainment is the norm in the SaaS industry, not 100% as many assume. Your sales team's consistency in reaching monthly, quarterly, or annual sales quotas relates to overall revenue performance and growth profile.
Quote To Close Ratio
Quote to close ratio compares the number of closed deals to quotes sent out. You calculate it by dividing closed and won deals by number of quotes and multiplying by 100. Their quote-to-close ratio is 20% if your sales rep achieved 30 closed deals out of 150 quotes.
This metric assesses your sales reps' effectiveness by comparing it to historical trends or current targets. A ratio of 20% to 30% is average in many industries, while a ratio above 30% may be seen as above average. The biotech industry has an average close ratio of 15%, software is 22%, and finance is 19%.
Key Performance Indicators For Sales Pipeline Health
Pipeline health determines whether your sales team can hit revenue targets consistently. These key performance indicators for sales reveal bottlenecks, forecast accuracy, and the speed at which opportunities convert into actual sales.
Pipeline Coverage And Velocity
Pipeline coverage compares the total dollar value of your sales opportunities against revenue targets. Calculate it by dividing total pipeline value by your sales target. Your coverage ratio is 2.5 if your quarterly target is $100,000 and your pipeline holds $250,000.
Enterprise sales teams maintain 3-5x coverage to account for longer sales cycles and multiple stakeholders. Mid-market B2B teams target 2.5-4x coverage, while high-velocity SMB sales operate with 2-3x coverage. Your historical win rate heavily influences your ideal ratio. You need at least 4x coverage just to break even if your team closes 25% of qualified opportunities.
Lead To Meeting Conversion Rate
Lead to meeting conversion rate tracks the percentage of qualified leads that convert to booked meetings. The median qualified-to-booked rate across high-performing B2B SaaS companies reaches 62%, while top quartile performers hit 72%. The best companies reach 88%.
Many teams still operate with sales processes and assume 35-40% represents solid performance. This reflects outdated manual scheduling and delayed responses. You should expect substantially higher conversion rates with modern infrastructure. Time-to-meeting should be tracked alongside conversion rate. A 60% conversion means little if the average time from form fill to booked meeting stretches to five days.
Average Sales Cycle Length
Average sales cycle length measures the time from your first touch with a prospect to closing the deal, averaged across all won deals. Calculate it by adding the number of days from first contact to customer conversion for all deals, then divide by the number of deals.
B2B companies average 102 days for the complete sales cycle. This breaks down to 84 days from lead to opportunity and 18 days from opportunity to close. Your actual cycle varies based on product complexity, customer size, number of decision-makers, and price point.
Deal Win Rate And Slippage
Win rate represents the percentage of deals won out of the total number of deals pursued. Calculate it by dividing closed-won deals by all opportunities created during the same timeframe. B2B sales teams benchmark at 6% win rate.
A higher win rate indicates your sales team closes deals more efficiently. This results in faster pipeline movement and higher velocity. Win rates serve as a fundamental indicator of sales team health. Top-performing sales organizations maintain win rates approximately 50% higher than their peers.
Customer Focused Sales KPIs For Long Term Success
Long-term success extends beyond closing deals. Customer-focused sales KPIs measure the value existing customers bring and predict future revenue stability.
Customer Lifetime Value
Customer lifetime value clv measures total revenue you expect from a single customer throughout your relationship. Calculate it by multiplying average purchase value by the purchase frequency and customer lifespan. For SaaS businesses, divide monthly average revenue per account by churn rate.
A healthy LTV: CAC ratio is 3:1 or higher. Your customer lifetime value should be at least three times your customer acquisition cost cac to cover operating costs and maintain profitability. Research shows that a 5% increase in customer retention increases profits anywhere from 25% to 95%. Retaining existing customers costs 5 to 25 times less than acquiring new ones.
Customer Retention And Churn Rate
Customer retention rate tracks the percentage of existing customers who remain after a given period. Churn rate measures the percentage who leave. Calculate churn by dividing customers lost by customers at the start of the period and multiplying by 100.
Top-performing B2B SaaS companies achieve 10% to 30% lower customer churn than average performers. Subscription businesses want annual churn below 5% to 7%.
Net Promoter Score
Net promoter score measures customer loyalty by asking how likely customers are to recommend your business on a scale of 0 to 10. Over 70% of Fortune 500 companies use this metric. Promoters score 9 to 10 while detractors score 0 to 6. Calculate NPS by subtracting the percentage of detractors from the percentage of promoters.
A 10-point increase in NPS is associated with a 3.2% increase in upsale revenue. A 7% increase in NPS equates to a 1% increase in total revenue.
How To Track And Visualize Your Sales KPIs
Sales KPIs only matter when teams track them with discipline. Clear dashboards help sales leaders see trends fast. Strong sales visibility into sales data improves sales performance, supports better decisions, and keeps revenue targets within reach.
Define The Right Sales KPIs First
Start with the right sales KPIs. Not every metric deserves attention. Sales activity metrics like number of leads or emails sent are useful. Critical sales KPIs connect directly to sales revenue and revenue growth.
Focus on conversion rate, customer acquisition cost CAC, customer lifetime value CLV, and average sales cycle length. Gartner reports that organizations that align KPIs with lead generation strategy are 2.3 times more likely to outperform competitors. Clear key performance indicators KPIs improve sales team performance and guide the entire sales team toward shared sales goals.
Align KPIs With Revenue Targets
Sales KPIs should support revenue targets. Every KPI must answer one question. Does this help hit revenue targets?
Link monthly sales growth, monthly recurring revenue, and closed deals to annual revenue goals. HubSpot data shows that companies with defined sales goals achieve 10 percent higher sales target attainment. Sales managers and sales leaders need direct visibility into sales pipeline health to track progress toward total revenue and consistent revenue growth.
Use CRM For Real-Time Visibility
Customer relationship management systems centralize sales data. Modern sales teams rely on CRM dashboards to monitor sales pipeline, sales opportunities, and customers acquired.
Salesforce research shows that high-performing sales organizations are 1.5 times more likely to use data-driven sales analytics. CRM tools track sales cycle length, average sales cycle, and average revenue per deal. Real-time access improves sales effectiveness and supports smarter sales strategy decisions.
Build Clear Sales Dashboards
Dashboards make complex data simple. Sales KPIs to track should appear in one clean view. Avoid clutter.
Show total revenue, monthly sales bookings, conversion rate, and number of deals. Include customer acquisition cost and customer lifetime value. McKinsey reports that companies using advanced analytics see up to 15 percent higher sales productivity. Clear visuals help sales reps and sales managers focus on important sales KPIs without distraction.
Track Individual And Team Performance
Sales KPIs differ across roles. Sales reps focus on sales activities, closed deals, and sales cycle performance. Sales managers focus on team performance and sales target attainment.
Transparent data improves accountability. Harvard Business Review found that clear performance measurement can improve productivity by 12 percent. Tracking sales KPIs across individual and team performance ensures alignment between daily sales efforts and long-term revenue growth.
Review KPIs Weekly And Monthly
Sales performance shifts quickly. Weekly reviews highlight early risks. Monthly sales reviews confirm long-term trends.
Monitor monthly sales growth, recurring revenue, and average profit margin. Evaluate customer retention and net promoter score alongside sales revenue. Consistent review cycles help sales organizations adjust strategy before problems grow. Strong review habits keep sales operations proactive and focused on critical sales KPIs.
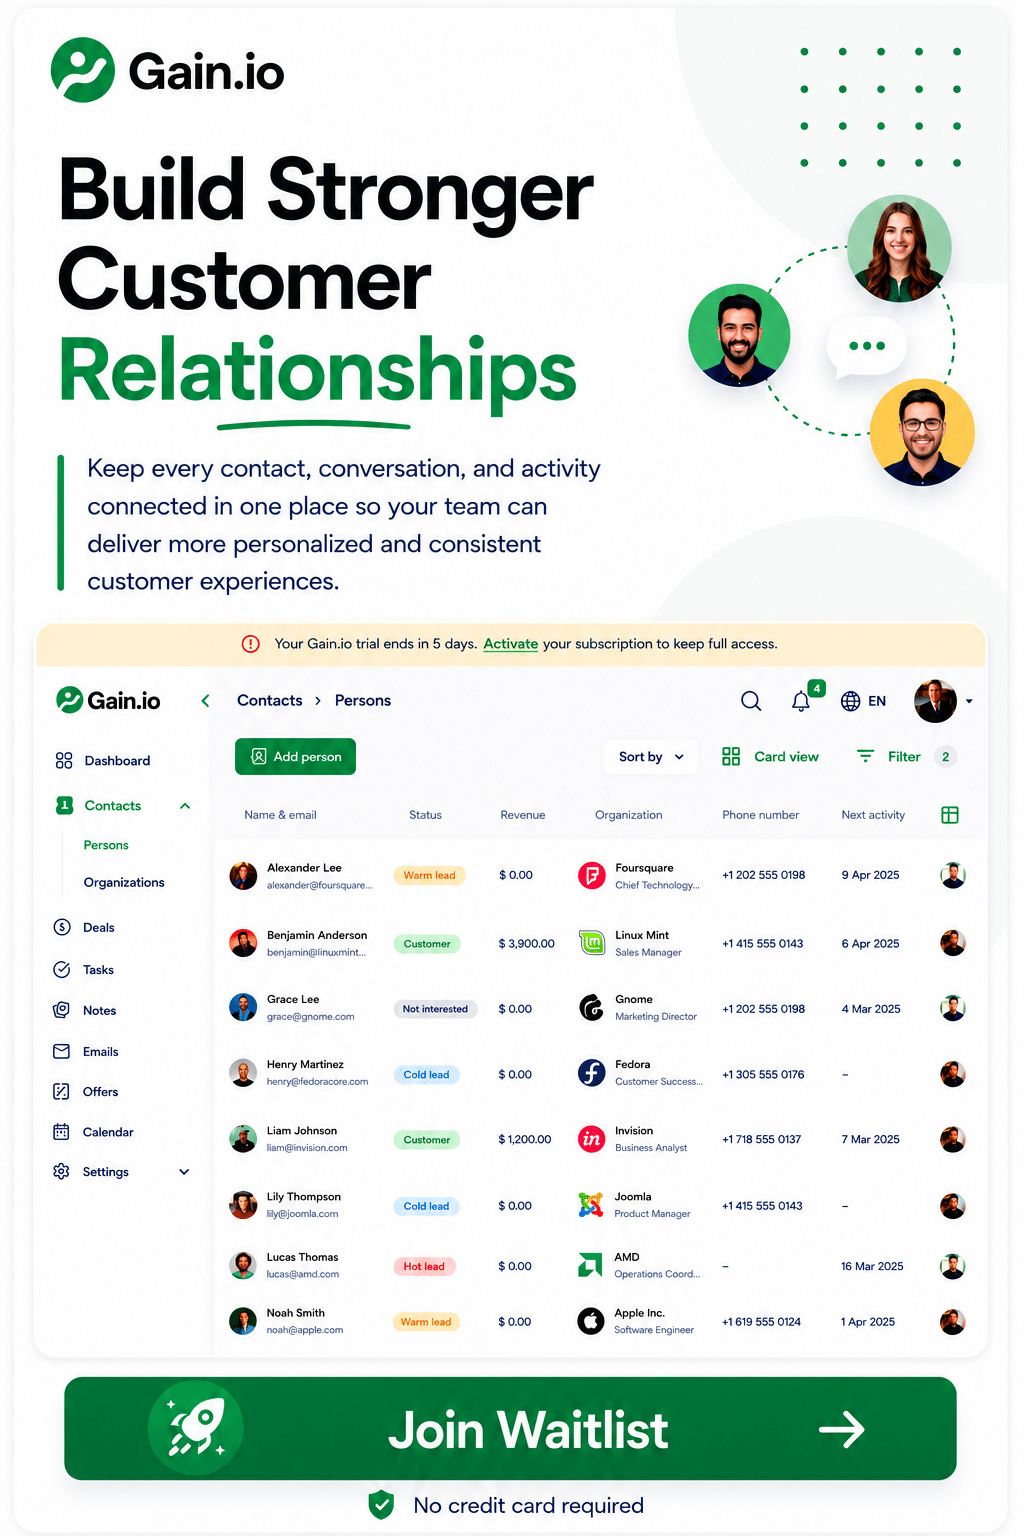
How Gain.io Helps You Track And Optimize Sales KPIs
Gain.io brings clarity to your sales KPIs in one unified view. Sales leaders no longer chase scattered sales data across tools. Gain.io has several key features. The platform connects sales pipeline, customer acquisition cost CAC, customer lifetime value CLV, and monthly recurring revenue into one actionable dashboard.
Modern sales teams need more than static reports. Gain.io supports real-time sales analytics, sales performance tracking, and sales revenue forecasting. Sales managers can monitor sales cycle length, conversion rate, monthly sales growth, and closed deals without manual effort. Clear visibility into critical sales KPIs improves sales productivity and sales target attainment.
Aligned sales strategy and sales operations become easier when the entire sales team works from the same data. Gain.io helps sales organizations turn key performance indicators KPIs into measurable revenue growth and consistent revenue results.
FAQs
How Many Sales KPIs Should A Small Sales Team Track?
Yes, most small sales teams should track only 5 to 7 critical sales KPIs. Focus on conversion rate, customer acquisition cost CAC, customer lifetime value CLV, monthly sales growth, and sales target attainment. Clear sales metrics improve sales performance without overwhelming the entire sales team.
Can Sales KPIs Improve Forecast Accuracy For Revenue Growth?
Yes, sales KPIs strengthen forecast accuracy when tied to real sales data. Metrics like sales pipeline coverage, average sales cycle length, and win rate help sales leaders predict total revenue. Strong sales analytics reduce guesswork and improve revenue targets planning.
Do Sales KPIs Differ Between B2B And B2C Sales Organizations?
Yes, sales KPIs differ based on sales strategy and sales cycle. B2B sales organizations focus more on pipeline health, customer lifetime value, and longer sales cycle length. B2C teams prioritize conversion rate, number of deals, and customer acquisition at scale.
Is Customer Lifetime Value More Important Than Customer Acquisition Cost?
No, both customer lifetime value CLV and customer acquisition cost CAC matter equally. Healthy sales performance depends on a strong LTV to CAC ratio. Sales leaders often aim for at least 3:1 to ensure sustainable revenue growth and recurring revenue stability.
Which Sales KPIs Help Identify Weak Sales Team Performance Early?
Sales target attainment, lead to opportunity conversion rate, and sales productivity often reveal early performance gaps. Low win rate or extended average sales cycle signals issues inside the sales process. Early tracking helps sales managers adjust sales efforts before revenue suffers.