Revenue leaders in 2025 face a familiar challenge. Forecasts are not just for quarterly board presentations anymore. They make weekly decisions on marketing spend, hiring timelines, and campaign launches. Getting them wrong means missed targets, wasted budget, or scrambling to fill gaps that should have been visible months ago.
The reality is that only around half of sales leaders report high confidence in their forecasts. Fragmented data, manual spreadsheet processes, and inconsistent CRM updates create uncertainty where clarity is essential. Yet the right sales forecasting methods can transform how your team plans and executes.
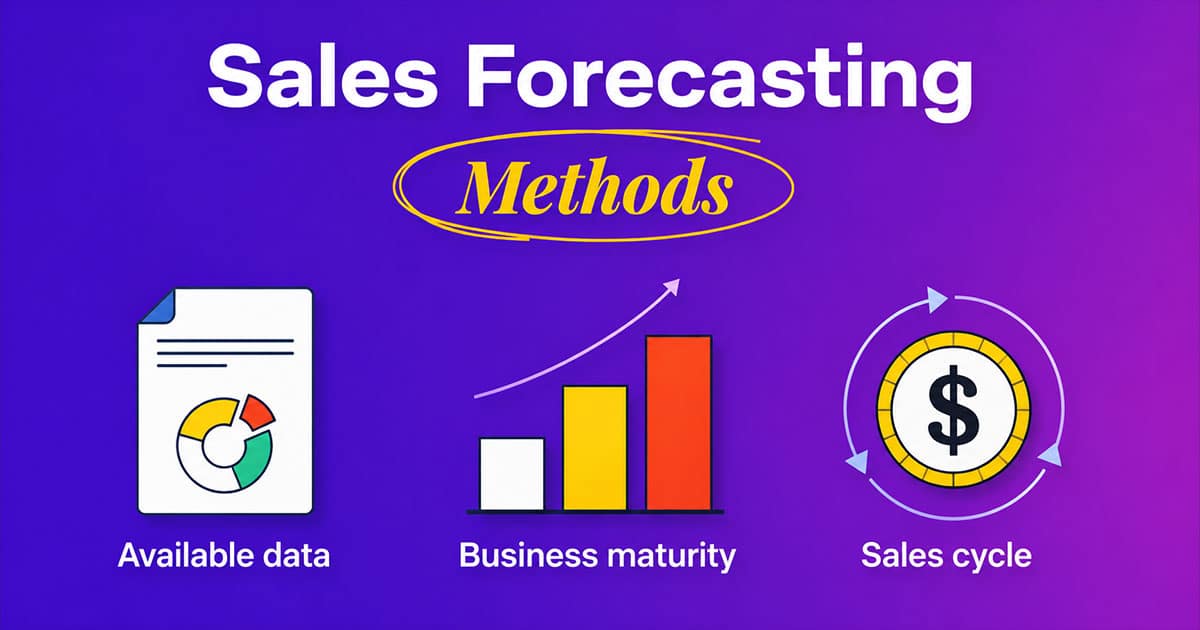
Sales forecasting methods range from simple historical curves to AI-powered models that ingest product usage, sales pipeline signals, and marketing engagement data. Some work best for stable, renewals-heavy businesses. Others shine when you have complex sales cycles or limited historical sales data. Most growing teams end up blending several approaches to get a complete picture.
This article walks through core forecasting methods, when to use each, and how to pair them with your revenue operations platform. By the end, you will have a practical framework for selecting the right sales forecasting method for your team and improving forecast accuracy over time.
What Sales Forecasting Is And Why It Matters
Sales forecasting predicts future sales volumes and revenues by analyzing historical results, current pipeline, and market context. It connects what happened last quarter with what your sales reps are working on today to estimate what is likely to close next month, next quarter, or next year.
Forecasts shape concrete decisions across your organization. Your CFO uses them to set Q3 2025 hiring plans. Your marketing team relies on them to allocate ad spend for a product launch. Your operations team needs them to plan inventory for seasonal peaks. Without a shared forecast, each function operates on different assumptions, and alignment suffers.
Consider a B2B SaaS company selling annual contracts. Their quarterly forecasts determine how many customer success managers to hire before renewal season. If the forecast underestimates new logo wins by 20%, the team is understaffed when customers need the most attention. If it overestimates, they carry unnecessary headcount costs.
Forecasting is less about perfect prediction and more about giving sales leaders and their partners a shared, data-backed view of what is likely to happen. That shared view enables faster decisions and reduces the friction that comes from conflicting assumptions about future revenue.
Core Quantitative Sales Forecasting Methods
Quantitative forecasting methods use numerical data to generate projections. They form the foundation for most enterprise forecasting processes because they are repeatable, measurable, and less subject to individual bias. This section covers classical, data-driven methods many teams use as their first forecasting layer.
Each method below includes a straightforward description, a simple example, and guidance on when it works best. The goal is practical application rather than academic depth.
Historical Forecasting
Historical forecasting projects future sales by looking at what happened in the same period one or two years ago, adjusted for growth or known changes. It assumes that past performance is a reasonable indicator of future demand.
For example, if your enterprise segment generated $2.4 million in Q4 2024 and $2.8 million in Q4 2025, you might forecast Q4 2026 revenue at $3.2 million by applying the same growth rate. This approach uses past sales data as the primary input and requires minimal statistical analysis.
Historical sales forecasting works best in stable, renewals-heavy businesses with predictable buying cycles and minimal pricing volatility. Subscription businesses with high retention rates often rely on this method for baseline projections.
The main risk is that historical forecasting can miss market shifts. A new competitor, a pricing change, or a large customer churn event will not show up in your historical trends until it is too late. Use this method as a starting point, not the final answer.
Straight Line Growth Forecasting
Straight line forecasting takes a recent growth rate and extends it uniformly into future periods. It is the simplest way to project revenue when you have consistent historical trends.
Suppose your monthly recurring revenue has grown at a steady 10% per quarter for the past year. Straight line forecasting assumes that rate continues, projecting $1.1 million next quarter if you ended this quarter at $1 million. The formula is simple: next period equals current period multiplied by one plus the growth rate.
This method appears frequently in long-range planning documents and board presentations because it is easy to understand and communicate. It provides a quick baseline for strategic planning discussions.
However, straight line forecasting can overpromise if you ignore sales team capacity constraints, market saturation, or upcoming product changes. Growth rates rarely remain constant indefinitely. Use this method for initial planning, then refine with more sophisticated approaches.
Moving Average And Exponential Smoothing
Moving average forecasting smooths out short-term swings by averaging sales over the last three, six, or twelve periods. It reduces the noise from one-time spikes or dips and reveals underlying trends.
Exponential smoothing is a variation that gives more weight to recent months while still considering older data. The smoothing factor, often called alpha, determines how quickly the model adapts to recent changes. A higher alpha responds faster to new trends but may overreact to temporary fluctuations.
Consider an online subscription business with noticeable monthly variation. Using a six-month moving average, you calculate that average monthly revenue has been $850,000. Your forecast for next month uses that smoothed figure rather than the volatile monthly actuals.
These techniques are useful for retail, ecommerce, and subscription businesses with seasonal trends but reasonably stable demand. They help you anticipate market trends without overreacting to short-term noise.
Regression Based Forecasting
Regression analysis looks for relationships between sales and drivers such as marketing spend, pricing, territories, or content output. It helps you understand not just what happened, but why it happened.
Imagine your revenue operations team models how changes in paid media budget and marketing qualified lead volume affect closed-won revenue. They discover that every $10,000 increase in paid spend correlates with a $50,000 increase in quarterly revenue, controlling for other economic indicators.
Single variable regression examines one driver at a time. Multi variable regression considers several factors simultaneously. Both require at least twelve to twenty four months of clean data across the variables being tested.
Regression-based forecasting excels when you want to forecast sales revenue based on specific inputs you can control or measure. It helps sales managers understand which levers most influence outcomes. The limitation is that it assumes relationships are linear and stable, which is not always true in dynamic markets.
Time Series Analysis
Time series forecasting analyzes sales over time to separate trend, seasonality, and random noise. It recognizes that your business may have predictable patterns that repeat annually, quarterly, or even weekly.
Techniques like autoregressive integrated moving average or seasonal decomposition identify these patterns mathematically. A direct-to-consumer brand might use three years of November and December sales data to forecast holiday season demand with high precision.
Time series models are helpful when seasonality and long-term trends matter more than individual deal details. They excel at predicting future demand for products with consistent sales cycles and seasonal trends.
The approach requires consistent historical sales data over multiple periods. If your business has changed significantly through acquisitions, new products, or market expansion, pure time series analysis may need adjustment to account for those structural changes.
Pipeline And Deal Level Sales Forecasting Methods
Pipeline-based methods rely on the current structure of opportunities in your CRM rather than only on historical totals. They are popular with B2B SaaS, agency, and enterprise sales teams that track opportunities over several months before closing.
For these methods to work, you need clean CRM data, standardized stages, and consistent activity logging from your sales reps. Without that foundation, pipeline forecasts become unreliable regardless of which technique you choose.
Opportunity Stage Forecasting
Opportunity stage forecasting assigns a probability to each stage in your sales process, then multiplies by deal value to calculate weighted pipeline. A deal in qualification might have a 10% probability, while verbal agreement might carry 70%.
Consider a quarterly forecast built from twenty deals across stages. Five deals at $100,000 each in qualification contribute $50,000 to weighted pipeline. Three deals at $200,000 in verbal agreement contribute $420,000. The sum across all opportunities becomes your projected revenue.
This method is effective when stages are well defined and win rates by stage are measured at least quarterly. It gives sales leaders visibility into how much revenue is truly likely to close versus what is simply in the pipeline.
The warning here is that if sales reps move deals between stages inconsistently, stage probabilities become misleading. A deal that has been stuck in “negotiation” for six months is probably not at the same probability as a deal that just entered that stage last week.
Length Of Sales Cycle Forecasting
Sales cycle forecasting uses the average sales cycle length from first meeting to close to estimate whether opportunities are on track or at risk. Deals that exceed the typical sales cycle duration get flagged for review.
If your average sales cycle is 90 days, an opportunity that has been open for 120 days without advancement signals trouble. It may be stalled, poorly qualified, or simply unlikely to close this quarter. Conversely, a deal moving faster than average might indicate strong buying intent.
Segmenting by deal size or channel improves accuracy. Inbound leads may have a 60-day cycle while outbound prospecting takes 120 days. Enterprise deals often run twice as long as mid-market opportunities. Consistent sales cycles within segments make forecasting more reliable.
This approach helps leaders identify stalled deals early and reallocate attention to healthier pipeline segments. It works best when you track close dates consistently and have enough deal history to establish meaningful benchmarks for complex sales cycles.
Lead Driven Forecasting
Lead driven forecasting starts with lead volume and quality metrics, then applies historical conversion rates and average deal sizes to project future revenue. It connects top-of-funnel activity directly to revenue expectations.
A marketing team might use monthly marketing qualified lead counts, historical win rates by source, and average contract values to forecast the next two quarters. If inbound leads convert at 15% and average $25,000, and you expect 200 inbound leads next quarter, you forecast $750,000 from that source alone.
This method works best when lead sources are tracked reliably and when you have at least a year of source-level performance data. It helps align sales and marketing planning because both teams can see how lead volume and quality translate to future sales.
The limitation is that lead quality can vary significantly. A surge in low-intent leads from a webinar campaign will not convert at the same rate as demo requests from your pricing page. Segmenting by source and quality tier improves forecast accuracy.
Multivariable Pipeline Forecasting
Multivariable analysis considers several deal attributes simultaneously to predict close probability. These attributes might include deal age, stage, deal size, segment, recent activity, and rep performance.
A revenue operations team might build a scoring model that weighs stage probability, days since last meeting, discount level, and whether a champion has been identified. Deals with high activity, reasonable discounts, and engaged champions score higher than stalled deals with unclear buying authority.
These methods often require specialized forecasting tools or analytics support. However, they can reach significantly higher accuracy for quarterly forecasts by incorporating multiple factors that simple stage-based models ignore.
Multivariable forecasting also helps identify which levers most influence outcomes. If deals with recent executive engagement close at twice the rate of those without, you know where to focus your team’s energy.
Qualitative And Scenario Based Forecasting Methods
Not all forecasts can rely on rich historical data. New markets, new products, or rapidly changing market conditions require approaches that incorporate expert judgment and structured scenarios. These methods complement quantitative analysis rather than replacing it.
Intuitive And Judgment Based Forecasting
Intuitive forecasting uses the experience of sales leaders, account executives, and regional managers to estimate revenue when data is thin. It captures knowledge that does not show up in CRM fields or spreadsheets.
Consider a team launching a new offering in early 2025. They combine insights from similar product launches, customer interview feedback, and partner conversations to form an initial forecast. The sales leader knows that enterprise buyers typically wait until Q2 to commit new budget, so they weight the forecast toward the second half of the year.
While subjective, this input is valuable when clearly documented and paired with quantitative methods. The key is creating guardrails. Compare intuitive forecasts to early actuals every month and adjust assumptions quickly when reality diverges from expectations.
Intuitive sales forecasting works best as one input among several rather than the sole basis for planning. Sales managers bring essential context about deal dynamics that models cannot capture.
Test Market And Experiment Driven Forecasting
Test market forecasting uses results from a limited region, segment, or campaign to project wider results. It reduces risk by validating assumptions before committing to full-scale execution.
A brand might test a new pricing tier with a subset of customers for one quarter before rolling it out globally. If the test shows 20% higher conversion rates with acceptable churn, they can confidently forecast what the new pricing will contribute to annual revenue.
Sample size, representativeness, and test duration matter greatly. A two-week test with 50 customers will not give you the same confidence as a three-month test with 500. Make sure your test population resembles the broader market you plan to target.
This method works well when teams have the ability to run controlled experiments and when the timeline allows for iteration before a full launch. It bridges the gap between guesswork and data-driven forecasting.
Delphi And Expert Panel Forecasting
The Delphi method gathers anonymous forecasts from multiple experts, then refines them through several rounds of feedback. Each expert provides an estimate independently, sees aggregated results, and revises their view. The process continues until the group converges on a range.
A large enterprise might use an internal panel of regional sales leaders and product managers to estimate sales for a new geography in 2026. Each contributor brings different market knowledge and customer relationships. Combining their perspectives reduces individual bias and groupthink.
The value comes from structured disagreement. When experts see that others have different assumptions, they reconsider their own. The final forecast reflects collective wisdom rather than the loudest voice in the room.
This approach helps most in volatile or poorly understood markets where no single person has complete information. It is time-intensive but valuable for high-stakes decisions like market entry or major product bets.
AI Driven Sales Forecasting Methods
AI forecasting has shifted from experimental to practical over the past several years. More accessible data, better sales forecasting software, and integrated CRM platforms have made machine learning available to mid-market teams, not just enterprises with data science departments.
These methods often blend historical, pipeline, and behavioral signals to produce continuously updated forecasts. They adapt as new information arrives rather than waiting for the next planning cycle.
Machine Learning Based Forecasting
Machine learning models detect patterns across many variables that humans would struggle to process simultaneously. They might analyze product mix, territory, engagement patterns, and macroeconomic indicators to predict which opportunities will close this quarter.
A revenue team might use deal email activity, meeting frequency, marketing touches, and past wins to score each opportunity. The model learns from thousands of historical outcomes to identify which combinations of signals predict success.
These models improve over time as more data flows through the system. However, they require clean, consistently captured data. If your CRM has gaps or your stage definitions change frequently, the model will learn the wrong patterns.
Think of AI as a way to support sales managers rather than replace human judgment. The model surfaces insights and patterns, but experienced leaders still need to interpret them in context and make final calls on major deals.
Scenario Modeling And What If Analysis
Scenario-based tools let leaders adjust assumptions and immediately see the impact on quarterly and annual forecasts. They answer questions like “what happens to Q4 revenue if we reduce paid spend by 20% in Q2?” or “how does hiring two more reps in March affect year-end attainment?”
These tools model the downstream effects of decisions before you commit to them. Marketing can see how lead volume changes affect pipeline. The sales team can see how hiring timelines affect quota capacity. Finance can see how all of it flows to the bottom line.
Scenario modeling is especially useful during planning cycles for fiscal years like 2025 or 2026 when leadership needs confidence in multiple possible paths. Instead of betting on a single forecast, you prepare for a range of outcomes.
This approach encourages cross-functional collaboration between finance, sales, and marketing. Everyone can see how their assumptions interact, which leads to more aligned planning and faster decisions when market dynamics shift.
How To Choose The Right Sales Forecasting Method For Your Team
The best forecasting model depends on your data maturity, sales motion, and planning horizon. Teams with five years of consistent CRM data have different options than startups with six months of history. Enterprise sales cycles require different approaches than high-velocity transactional businesses.
Most teams end up using a hybrid approach. They might combine historical forecasts for the annual plan with pipeline-based models for the next quarter and AI-powered deal scoring for weekly prioritization. The goal is using the right tool for each planning horizon.
Think about your constraints. How much reliable data do you have since 2022? How complex is your sales process? How much time can your team invest in forecasting each cycle?
Match Methods To Data Availability
If you only have six to twelve months of sales data, start with simple historical or straight line methods. These approaches require minimal data and provide reasonable baselines for young companies. They will not be highly accurate, but they give you something to work with.
Once you have at least two to three years of consistent sales and marketing records, you can layer in time series analysis, regression forecasting, or multivariable models. These techniques need enough data to identify meaningful patterns rather than noise.
Teams with patchy data should lean more on qualitative and scenario methods while they improve their CRM and analytics foundations. Document your assumptions, update forecasts monthly, and treat the first year as a learning period for building a more accurate forecasting process.
Align With Sales Motion And Deal Complexity
Transactional, high-volume businesses often benefit most from time series and lead-driven methods. When you close hundreds or thousands of deals per quarter, individual deal dynamics matter less than aggregate patterns. You want to predict sales based on lead volume and conversion rates rather than examining each opportunity.
Enterprise and mid-market B2B teams usually rely more on opportunity stage forecasting, sales cycle length methods, and AI-enhanced pipeline models. When deals take months to close and individual outcomes significantly impact quarterly results, you need granular visibility.
Consider segmenting forecasts by motion rather than forcing one method across all revenue streams. Separate self-serve, inside sales, and field sales forecasts. Each motion has different sales patterns, cycle lengths, and drivers.
Balance Accuracy, Effort, And Speed
Some forecasting models take hours or days of analyst time each cycle. Others can be updated weekly by sales leaders in minutes. The most sophisticated model in the world is useless if your team cannot maintain it.
Choose methods that deliver enough accuracy to confidently plan headcount and budget without becoming too heavy to maintain. A forecast that is 85% accurate and updated weekly beats a 95% accurate forecast that is only refreshed quarterly.
A simple progression works for most teams. Start with historical plus stage-based forecasts. Add lead-driven projections as your marketing data matures. Layer in multivariable or AI methods once you have the data foundation and tools to support them.
Six Best Practices For Reliable Sales Forecasting
Method choice alone will not fix forecasting without strong process, data discipline, and cross-functional collaboration. These practices help revenue leaders implement forecasting improvements over the next one to two quarters.
Invest In Data Quality And CRM Hygiene
Accurate forecasts depend on complete, timely updates to deal stages, values, close dates, and product mix. Every missing field or outdated opportunity degrades your model’s reliability.
Implement simple governance practices. Conduct weekly pipeline reviews where managers verify deal details with reps. Establish clear rules for when deals can move between stages. Define what each stage means so everyone applies the same standards.
Capture marketing touches, content engagements, and campaign launch dates consistently. This data helps tie revenue back to specific activities and improves lead-driven and regression-based forecasts over time.
Standardize Definitions And Processes
Teams need shared definitions for concepts like marketing qualified lead, sales qualified opportunity, and commit deal. Without common language, forecast meetings devolve into debates about what numbers actually mean.
Create a one-page forecasting playbook that lists stages, probabilities, and data entry expectations for the entire sales team. New hires should understand exactly how to log opportunities and when to update them.
Revisit these standards annually or after major changes to products, pricing, or markets. What worked in 2023 may not fit your 2025 business model.
Update Forecasts Frequently Enough To Be Actionable
Fast-moving, transactional teams may refresh forecasts weekly. Enterprise teams often use a biweekly or monthly cadence. The right frequency depends on how quickly your pipeline changes and how soon you need to act on forecast shifts.
Mid-quarter adjustments matter. When a large deal slips or an unexpected opportunity enters the pipeline, update the forecast promptly. Real time data enables leadership to course-correct marketing and content plans while there is still time to influence outcomes.
Regular updates also build confidence in the forecasting process. When the team sees forecasts evolving with reality rather than becoming stale, they trust the numbers more.
Combine Quantitative Models With Context From The Field
Overlay rep and manager insights on top of the numbers, especially for large or strategic deals. Models cannot capture everything. A buyer’s internal politics, a competitor’s last-minute discount, or a champion’s job change all affect outcomes in ways that data cannot predict.
Structure forecast meetings to review model outputs first, then collect qualitative risk and upside notes on key opportunities. This approach respects both the data and the judgment of experienced sales professionals.
Healthy skepticism of both pure gut feel and pure models leads to more accurate forecasts. Neither approach alone tells the complete story.
Plan For Seasonality And External Factors
Many businesses see predictable peaks and valleys around events like year-end budget flushes, summer slowdowns, or major industry conferences. External factors like economic indicators, competitive moves, and regulatory changes also influence sales patterns.
Document assumptions about seasonality and macroeconomic conditions. If you expect a recession to slow enterprise buying in 2025, build that into your forecast and track whether reality matches your assumption. Review these assumptions quarterly and update them as conditions change.
Account for specific events that affect your industry. B2B software companies often see spikes before fiscal year end. Retail businesses plan around Black Friday. Build these known patterns into your sales forecasting model rather than treating them as surprises.
Use Tools That Reduce Manual Work And Improve Collaboration
Platforms that centralize pipeline data, content workflows, and campaign execution help sales and marketing operate from the same source of truth. When everyone sees the same numbers, alignment improves automatically.
Automated reminders, approval trails, and version control keep revenue activities aligned with forecasts. You spend less time reconciling spreadsheets and more time refining predictions and hitting sales targets.
When execution is centralized, it becomes easier to attribute revenue to specific initiatives. That attribution data improves future forecasting by showing which activities actually drive sales outcomes.
How Gain.io Helps Teams Operationalize Sales Forecasting Methods
Sales teams often struggle to move from theory to execution because sales forecasting challenges arise from scattered data, inconsistent inputs, and changing market signals. Gain.io helps organizations build a structured sales forecasting process that improves sales forecasting accuracy and supports more reliable decision-making. By combining CRM data with advanced analytics, teams can generate forecasts that reflect real pipeline activity and historical patterns.
The platform also supports a proven sales forecasting methodology that enables managers to create an accurate sales forecast and achieve highly accurate sales forecasts over time. With better visibility into future sales trends and tools to predict future sales based on real-time insights, leaders can strengthen their sales strategy, avoid common sales forecasting mistakes, and allocate resources effectively using reliable past data.
FAQs
How Often Should A Growing B2B Company Revisit Its Sales Forecasting Method
Teams should review their chosen methods at least once per year, or after significant shifts such as entering a new market, changing pricing, or launching a major product. What worked for a 20-person sales team may not scale to 100 reps across multiple regions. Run a simple backtest twice a year by comparing prior forecasts to actuals. If your Q2 forecast was off by 25% and Q3 was off by 30%, something in your methodology or data quality needs attention. Continuous improvement is more valuable than finding the perfect method once.
What Is A Reasonable Accuracy Target For Quarterly Sales Forecasts
Many mature B2B teams aim to land within plus or minus 10% of their quarterly forecast at the company level. This range gives finance enough confidence to plan budget and headcount while acknowledging that perfect prediction is impossible.
How Can Smaller Teams Forecast Sales When They Have Less Than One Year Of Data
Combine simple straight line or opportunity stage methods with intuitive input from founders and early sales reps. These team members often have the deepest understanding of customer buying patterns and competitive dynamics, even without formal data.
Should Marketing And Sales Use The Same Forecasting Approach
The underlying revenue target should be shared, but the methods may differ. Marketing often uses lead-driven or campaign-based forecasts that start with MQL volume and conversion rates. Sales typically relies on pipeline and deal-level methods that examine individual opportunities.
When Does It Make Sense To Invest In AI Based Forecasting Tools
AI tools deliver the most value once a company has at least one to two years of consistent CRM usage and clear sales processes. The algorithms need enough data to identify meaningful patterns and enough consistency to avoid learning from noise.