A green dashboard doesn't always mean a healthy customer. Plenty of teams track logins, run a quick NPS survey, and call it a health score, only to watch a "healthy" account cancel two weeks later. The problem usually isn't the intent. It's the math.
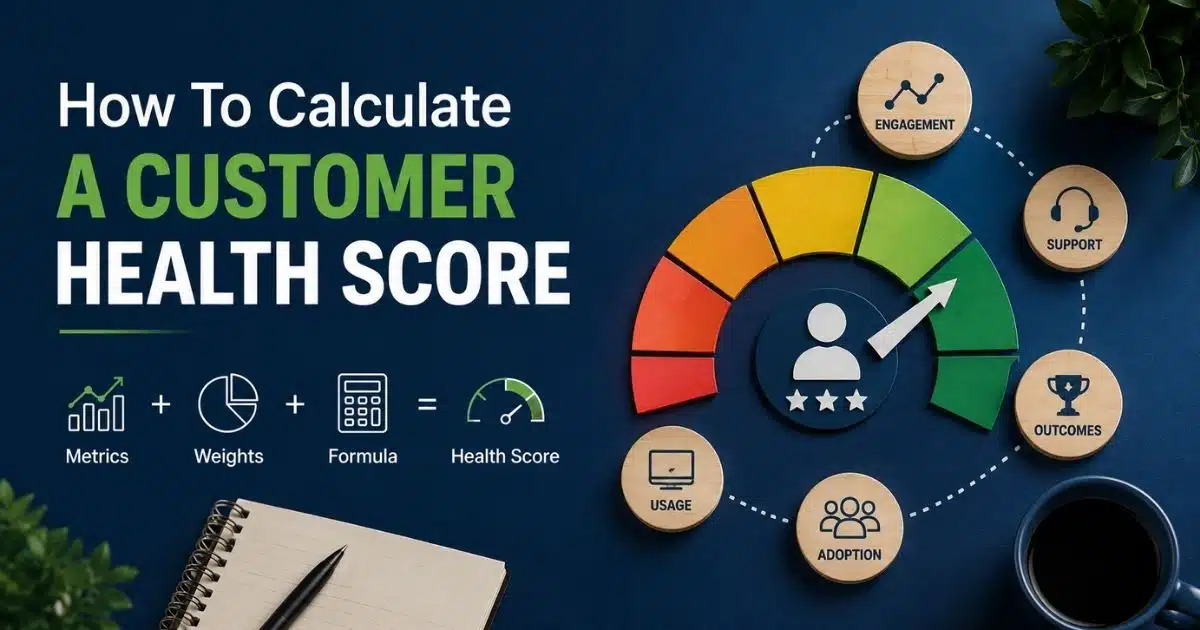
A real customer health score isn't a single metric dressed up in a color. It's a weighted formula built from signals that actually predict churn, calculated consistently, and tied to a threshold that tells you when to act. Most guides stop at theory. This one walks through the actual calculation, step by step, with real numbers plugged in. By the end, you'll know exactly how to build your own formula, set your score ranges, and use the result to catch at-risk customers before they leave.
What Is A Customer Health Score
A customer health score is a single number that shows how likely a customer is to stay, renew, or churn. Customer success teams calculate customer health scores by combining signals like product usage, support activity, and customer satisfaction surveys into one weighted formula.
The score gives customer success managers a fast way to spot risk without digging through five different tools. Most platforms pull this together through integration capabilities that connect CRM software, product, and billing data, turning scattered signals into one number teams can actually act on.
Importance Of Customer Health Score

A number on a dashboard means nothing without context. Here's what actually makes a customer health score important, and why teams build one in the first place.
Predict Customer Churn
A customer health score formula exists mainly to answer one question: who's about to leave. Declining usage, fewer logins, and ignored emails usually show up weeks before a cancellation request does.
Catching that pattern early gives teams room to act. Waiting for a churn notice means the decision's already made, but a dropping score gives customer success managers a real window to change the outcome.
Track Customer Engagement
Engagement doesn't stay constant, and it shouldn't be assumed. When you create a customer health score, you're building a way to track how customers actually interact with the product over time, not just at onboarding.
This matters because engagement often shifts quietly. A customer who was active for months can go dark for weeks, and without tracking, nobody notices until it's a problem.
Spot Customer Risks
Some risks show up in the data long before they show up in customer feedback. A final customer health score pulls together support tickets, usage drops, and payment delays into one signal instead of scattered warning signs.
Spotting risk early changes what's possible. A team that catches a warning sign 30 days out has options; a team that finds out at renewal usually doesn't.
Improve Retention Efforts
Retention efforts work best when they're targeted, not blanket. Health scores tell teams exactly which customer relationships need attention right now, instead of spreading limited time evenly across every account.
Proactive outreach beats reactive fixes almost every time. Customer retention improves when at-risk accounts get a call before they file a complaint, not after a cancellation email forces the conversation, especially when those efforts are supported by customer retention CRM strategies.
Guide Customer Success
Customer satisfaction and customer satisfaction score aren't the same as a health score, but they feed into it. A well-built score gives customer success teams a shared reference point for prioritizing which accounts need a call this week.
Gut feeling doesn't scale past a handful of accounts. A shared number does, turning customer outcomes into something the whole team can act on together instead of relying on whoever remembers to check in.
Customer Health Score Metrics

Not every metric belongs in a health score, and picking the wrong ones is how scores end up useless. Here are the five categories worth building a scoring system around.
Product Usage
Login frequency and session length are the most direct read on account health available. Customers who stop showing up in usage data are almost always the first sign of trouble, well before anything shows up in a support ticket.
Customer success leaders weight this heavily for good reason. Usage decline tends to lead other warning signs by weeks, which makes it one of the earliest, most reliable inputs into any customer health scorecard.
Feature Adoption
Logging in isn't the same as getting value. A customer who only ever touches one basic feature is at higher risk than one exploring the product's core workflows, even if their login counts look identical.
This is where customer segments matter. Adoption benchmarks differ by plan and use case, so what counts as healthy adoption for one segment might flag as a concern for another.
Customer Engagement
Beyond the product itself, engagement covers how customers interact with your team. Email opens, webinar attendance, and community activity all signal whether a customer is invested or quietly drifting away, which makes accurate customer interaction tracking in CRM a critical input.
Low health scores often show up here first, even when usage still looks fine on paper. A customer who stops replying to check-ins is telling you something, even if they're still logging in daily.
Support Activity
Ticket volume alone doesn't tell the full story. A spike in tickets can mean genuine frustration, or it can mean a customer engaged enough to ask questions and push for more value.
What matters more is the trend and tone. Repeated escalations, unresolved issues, or a shift toward negative sentiment all hurt customer experience and deserve real weight in the scoring model.
Business Outcomes
Usage and support data matter, but they're proxies. Business outcomes- hitting a goal, seeing ROI, or improving a specific metric- are the actual reason a customer renews or churns.
Net promoter score and outcome surveys help close that gap. They capture whether customers feel the product delivered real value, which usage numbers alone can't always confirm, especially when you compare results across customer lifecycle stages.
How To Build A Customer Health Score Model

Building the model comes before running the math. Get this part right, and the calculation itself is straightforward. Here's how to structure it.
Define Scoring Goals
Start with what the score actually needs to answer, not the metrics you happen to have. A score built to predict churn looks different from one built to flag expansion opportunities, even though both pull from similar data, and both should connect back to how you use CRM tools for customer retention.
Tie this back to business objectives early. A score with no clear purpose ends up tracking everything and predicting nothing, which defeats the point before you've picked a single metric.
Select Relevant Metrics
Once the goal is clear, pick key metrics that actually connect to it. Product usage data, support tickets, and engagement signals all matter, but only the ones tied to your specific customer base and product and how you manage them in a customer engagement CRM.
Resist the urge to include everything available. Effective health scores stay lean, built on a handful of signals that move the needle, not a long list that dilutes the final number.
Assign Metric Weights
Not every metric deserves equal weight. Usage patterns tend to predict churn earlier than sentiment surveys, so they usually carry more weight in a well-built formula.
Base weights on how customer behavior actually plays out over time, not gut instinct. Historical data on past churns and renewals is the best guide for deciding which signals move first when scores drop.
Set A Scoring Formula
With metrics and weights defined, the formula itself is just multiplication and addition. Each metric gets scored on a common scale, multiplied by its weight, then summed into one final number.
This step is mechanical, which is the point. A clear formula means anyone on the team can recalculate a score the same way, instead of guessing at how key features factor into the result.
Test And Adjust
A first version is never final. Run the formula against historical data and check whether it actually would have flagged customers who churned, or missed them entirely.
This is just the beginning of the process. Weights and thresholds usually need adjusting more than once before the score reliably matches real outcomes across your full customer base.
Calculating Your Composite Health Score
The formula itself is simple math once the groundwork is done. Here's how to turn standardized metrics and assigned weights into one final composite number, step by step.
Standardize Each Metric's Scale
Every metric needs to land on the same scale before it can be combined with the others. Usage, support activity, and engagement all get scored from 0 to 100, regardless of their original units.
This step matters more than it looks. A raw login count and a support ticket count live on completely different scales, and combining them without standardizing first produces a number that means nothing.
Apply Each Metric's Weight
Once every metric sits on the same scale, multiply each score by its assigned weight. A metric weighted at 40% contributes far more to the final number than one weighted at 10%, exactly as intended, much like how successful CRM adoption in sales teams depends more on a few critical behaviors than every possible data point.
This is where the model's priorities actually take effect. Weighting reflects which signals predict churn earliest, so the math should mirror the same judgment calls made when the model was first built and how you prioritize CRM adoption strategies to improve ROI.
Sum The Weighted Scores
Add every weighted metric together to produce one composite number. This single figure, typically landing between 0 and 100, becomes the customer's health score for that scoring cycle.
Double-check that all weights sum to 100% beforehand. If they don't, the total won't land on a consistent scale, and scores across different customers stop being comparable to each other.
Customer Health Score Calculation Example
Formulas only make sense once you see them applied to a real customer's journey. Here's a full walkthrough, using a fictional B2B SaaS customer, "Meridian Co.," at the renewal stage of their lifecycle.
This kind of example works as an early warning system precisely because it shows how customers engage across multiple signals at once, not just one. A single healthy metric can mask real risk sitting in the others, which is exactly why the composite approach matters.
Step 1: Choose The Metrics And Weights
Metric | Weight |
|---|---|
Product Usage | 40% |
Support Activity | 25% |
Customer Engagement | 20% |
Feature Adoption | 15% |
Step 2: Score Each Metric On A 0-100 Scale
Meridian Co. logs in daily and uses core workflows consistently, but recently opened three support tickets and hasn't responded to the last two check-in emails, an early shift in customer sentiment worth flagging on its own.
Metric | Raw Signal | Standardized Score |
|---|---|---|
Product Usage | Daily logins, steady session length | 85 |
Support Activity | 3 tickets in 30 days, ticket volume trending up | 55 |
Customer Engagement | No email replies in 3 weeks | 40 |
Feature Adoption | Uses 4 of 10 key features | 60 |
Step 3: Apply The Weights
Metric | Score | Weight | Weighted Value |
|---|---|---|---|
Product Usage | 85 | 0.40 | 34.0 |
Support Activity | 55 | 0.25 | 13.75 |
Customer Engagement | 40 | 0.20 | 8.0 |
Feature Adoption | 60 | 0.15 | 9.0 |
Step 4: Sum The Weighted Values
34.0 + 13.75 + 8.0 + 9.0 = 64.75
Meridian Co.'s customer's score comes out to 64.75 out of 100.
What This Actually Tells You
On its own, strong product usage would suggest a healthy account. But the composite score pulls that down to the mid-60s once support friction and disengagement get factored in.
Depending on how score ranges are set, a mid-60s result usually lands in a "watch" band rather than "healthy." That's the trigger point for building a proactive success plan, not waiting for the next renewal conversation to surface the problem.
This same output does more than flag risk. Teams also use these scores to group customers by lifecycle stage, identify expansion opportunities among the strongest performers, and even inform marketing efforts aimed at advocacy or upsell campaigns.
How To Set Customer Health Score Ranges

A score without ranges is just a number floating on a dashboard. Here's how to turn that number into bands your team can actually act on.
Define The Score Scale
Most teams settle on a 0-100 scale, since it's intuitive and easy to communicate across departments. Whatever range you pick, keep it consistent across every customer segment so comparisons stay meaningful.
This choice is one of the key components of the whole system. A scale that changes between teams or products makes scores impossible to compare, which defeats the purpose of building one in the first place.
Set Healthy Scores
Healthy typically sits at the top of the range, often 75 and above, depending on your formula. Customers here show strong customer signals across usage, engagement, and support, with nothing pulling the score down.
This band deserves attention too, not just relief. Sales teams and customer success can use healthy accounts to identify expansion opportunities, since strong scores often signal readiness for upsell conversations.
Identify Warning Scores
The middle band, often 50 to 74, catches customers who aren't failing but aren't thriving either. This range delivers valuable insights precisely because it's where intervention still has the most impact.
Catching a customer here beats catching them later. Once a score drifts into warning territory, proactive outreach has a real shot at reversing the trend before it slides further down.
Mark Critical Scores
Below 50 usually signals real risk, accounts likely to churn without immediate action. Support friction, disengagement, and usage decline typically stack together by the time a customer lands in this band.
Speed matters most here. A critical score means the save window is closing, so outreach needs to happen fast rather than waiting for the next scheduled check-in.
Validate Score Thresholds
Ranges aren't set once and forgotten. Gather data on past churns and renewals, then check whether your thresholds actually predicted those outcomes or missed them entirely.
Keeping scores accurate takes ongoing work. Collecting data over each cycle and comparing it against real results is the only way to know if 75 and 50 are still the right cutoff points for your customer base.
How To Use Customer Health Scores To Identify At-Risk Customers

A calculated score only matters once someone actually acts on it. Here's how to turn the number into a working process for catching churn risk early.
Monitor Score Changes
A single score tells you where a customer stands today, but the real value comes from watching it move. A drop from 80 to 60 over a month matters more than the number itself.
Regularly review score distribution across your whole customer base, not just individual accounts. This surfaces patterns automated workflows can miss, like several accounts drifting down at once after a pricing change or outage.
Identify Risk Signals
Once a score moves, dig into which data points actually shifted. Usage decline, a spike in support history, or silence on outreach attempts are the early warning signs behind most drops, and a CRM with email integration makes those communication gaps much easier to surface.
This step turns a number into actionable insights. Knowing a score fell is useful, but knowing it fell because a customer stopped seeing value realization from the product or because email engagement tracking shows declining response is what actually shapes the next move.
Segment At-Risk Accounts
Not every at-risk account needs the same response. Segment by business model, contract size, or how they use your product or service, since customer needs vary sharply across those lines.
This is also where you assign weights based on account value. A large enterprise account slipping into warning territory deserves faster attention than a smaller self-serve customer showing the same pattern.
Prioritize Customer Outreach
With accounts segmented, decide who gets contacted first. Combine metrics like churn risk, contract value, and time since last engagement to rank outreach instead of working through a flat list, just as sales teams rely on CRM systems for managing and prioritizing leads.
Speed matters more for some accounts than others. A high-value customer with a rapidly falling score should reach the top of that list well before a stable account with a minor dip, which is much easier when you've chosen CRM tools that fit your workflow.
Track Recovery Progress
Outreach isn't the finish line. Once a team engages an at-risk account, track whether the score actually improves over the following weeks, not just whether a call happened.
This closes the loop on the whole process. Recovery tracking reveals which interventions genuinely work, so future outreach can lean on tactics with a real track record instead of guesswork.
How Often Should You Recalculate It?
Most teams recalculate health scores weekly or monthly, depending on how fast customer behavior typically shifts. High-touch enterprise accounts with slower usage cycles often work fine on a monthly cadence, while product-led or self-serve customers need weekly updates to catch fast-moving drops.
The right frequency also depends on your data sources. If usage and support data update in real time, recalculating weekly makes sense. If key metrics only refresh monthly, recalculating more often just repeats stale numbers.
Whatever cadence you choose, keep it consistent. Irregular recalculation makes trends impossible to read, and trends, not the single number, are what actually predict churn.
FAQs
How Many Metrics Should Go Into A Customer Health Score?
Most effective models use 4 to 6 metrics. Fewer than that makes the score too thin to trust, while more than 6 usually adds noise instead of accuracy. Pick metrics that actually predict churn, not just ones that are easy to collect.
Can Small Businesses Calculate Health Scores Without A CS Platform?
Yes, a spreadsheet works fine for smaller customer bases. Pull usage, support, and engagement data manually, apply the same weighted formula, and recalculate on a set schedule. The math stays the same regardless of the tool running it.
What's A Good Customer Health Score Benchmark?
There's no universal number, since benchmarks depend on your product and customer base. Most teams treat 75 and above as healthy, 50 to 74 as a warning zone, and below 50 as critical, then adjust those cutoffs against their own churn data over time.
How Is A Customer Health Score Different From An NPS Score?
NPS measures how likely a customer is to recommend your product, based on a single survey question. A health score combines multiple signals, usage, support, engagement, into one composite number. NPS can feed into a health score, but it's only one input among several.
Can A Customer Health Score Predict Expansion, Not Just Churn?
Yes, the same formula works both directions. A high, stable score often signals a customer getting strong value, which usually means they're a good fit for upsell or expansion conversations, not just a safe bet against churn.