Between 2020 and 2025, sales reporting became mission-critical for B2B companies. The rapid shift to remote selling disrupted traditional deal cycles, extending average sales cycles by 20-30% according to industry research. Longer cycles averaging 4-6 months in enterprise SaaS, combined with tighter budgets where sales budgets contracted by an average of 15% in 2023, forced revenue teams to rely on data-driven visibility rather than gut feel.
Consider a mid-sized SaaS company targeting $50M ARR in 2026. Weak sales reporting, such as incomplete CRM data on deal stages and stalled opportunities going unnoticed, led similar firms to a 25% forecast miss in Q4 2025. The result was reactive hiring freezes and lost market share, while competitors using signal-led reporting closed deals 2.5x faster.
This article is written for sales leaders, RevOps professionals, and GTM teams who already have a CRM like Salesforce or HubSpot but struggle with consistent, actionable insights from multi-touch, multi-stakeholder B2B journeys.
What Is Sales Reporting?
Sales reporting is the systematic process of aggregating, analyzing, and visualizing sales data from core systems, primarily CRMs, billing platforms, and marketing automation tools, into structured reports and dashboards that deliver curated insights rather than raw data exports.
Typical timeframes encompass:
- Daily activity snapshots tracking rep motions like calls and emails
- Weekly pipeline inspections revealing coverage ratios
- Monthly performance recaps evaluating quota attainment
- Quarterly deep dives into ARR components
- Annual planning documents for board reviews
Core datasets in B2B contexts include opportunities with stage progression, sales pipeline health metrics with pipeline values segmented by ACV tiers, win/loss ratios averaging 22% to 28% industry-wide, and revenue metrics like new ARR, expansion ARR, and churn rates. Sales velocity, calculated as (opportunities × win rate × average ACV) ÷ sales cycle length in days, is a key composite metric.
Effective sales reporting transcends data dumps by answering targeted questions. What is the quarterly attainment probability? Where are deals stalling? Which segments are growing? Modern sales teams rely on live dashboards that update in real time, reducing reliance on static Excel decks that 62% of RevOps leaders cite as a top pain point.
Benefits Of Sales Reporting
Sales reporting provides structured visibility into performance, enabling revenue teams to make informed decisions, optimize workflows, and drive consistent growth. When built on accurate data, it transforms daily sales activities into measurable outcomes.
Better Performance Visibility
Sales reporting gives sales teams and sales managers a clear view of sales performance across the entire sales process. Instead of relying on assumptions, teams can track performance using key metrics like conversion rates, pipeline value, and sales cycle length.
This visibility helps identify gaps in execution and highlights where individual sales reps or segments underperform. With access to up to date data, teams can quickly adjust strategies and improve overall performance outcomes.
Improved Forecast Accuracy
Accurate sales reporting plays a critical role in improving forecast accuracy. By analyzing historical sales data and current pipeline trends, sales leaders can predict future revenue with greater confidence.
A well-structured sales pipeline report helps detect stalled deals and unrealistic projections early. This allows teams to correct course before forecasts impact business planning or resource allocation.
Data Driven Decision Making
Sales reporting enables data driven decisions by converting raw data into actionable insights. Instead of guesswork, sales leaders understand which strategies, channels, and campaigns generate results.
These valuable insights support better sales strategy development and help prioritize high-impact opportunities. Teams can identify trends and refine their approach based on real performance data.
Higher Revenue Growth
One of the key benefits of sales reporting is its direct impact on revenue growth. By tracking sales activities and outcomes, teams can identify what drives success and replicate those efforts.
Sales reporting tools help optimize the entire sales funnel, from lead generation to deal closure. This continuous improvement approach helps drive revenue growth and improves overall sales efficiency.
Stronger Team Alignment
Sales reporting improves alignment between sales teams, sales management, and leadership. A shared view of performance ensures everyone works toward the same business goals.
With a consistent reporting process, sales leaders understand team performance and can guide improvements effectively. This alignment strengthens accountability and ensures that all sales efforts contribute to measurable outcomes.
When To Integrate Sales Reporting Across Revenue, Marketing, and Customer Success
The strongest B2B organizations no longer treat sales reporting in isolation. They connect it to marketing, onboarding, and retention data from CRM, marketing automation, customer success platforms, and billing systems.
Integration helps answer full-funnel questions: “Which campaigns generate customers with the highest customer lifetime value?” rather than only “Which campaigns generate the most leads?”
Connecting Marketing Attribution to Sales Outcomes
Bringing campaign and channel data into sales reports shows actual revenue and win rates per source, not just lead volume. Charts should compare, for example, webinar-generated opportunities (28% win rate, 90-day sales cycle) with paid search leads on ACV, cycle length, and retention.
Monthly “pipeline by source” dashboards inform budget reallocation decisions. Start with first- or last-touch attribution if data maturity is low, progressing to multi-touch as capabilities mature. Marketing and sales leadership should co-own this review to drive revenue growth together.
Bridging Sales and Customer Success Metrics
Integrate onboarding, usage, and renewal data to reveal whether certain deal types are more likely to churn or expand. Reports should include:
- NRR by original sales segment (enterprise at 125%)
- Time-to-value metrics (45 days average)
- Product adoption rates by acquisition channel
This allows sales teams to refine ICP definitions based on 12-24 months of cohort data. Create a joint monthly dashboard reviewed by sales, CS, and product. Identifying segments with systematically poor fit informs prospecting criteria and improves sales outcomes.
Aligning Finance Forecasts With Sales Reporting
Finance relies on accurate sales reporting for revenue forecasting, headcount planning, and budgeting. Create shared forecast models combining opportunity-level data (1-2 quarters) with historical trends and seasonality for longer horizons.
Include variance analyses such as forecast versus actual by month, segment, and region. Establish monthly forecast reconciliation between sales leaders and finance. Consistent definitions for “committed” versus “upside” deals are critical, as this alignment helps forecast revenue with confidence.
Sharing Reporting in Cross-Functional GTM Meetings
Integrated reports should become the backbone of GTM meetings. Use one standardized dashboard instead of ad-hoc slides.
Sample Agenda:
- 10 minutes: Performance review
- 20 minutes: Pipeline risks
- 20 minutes: Cross-functional decisions and actions
Include action-tracking with clear owners and due dates. This prevents siloed decision-making where each department optimizes its own key metrics at the expense of overall business goals.
Establishing a Single Source of Truth for Revenue Data
Integrated sales reporting depends on clear systems of record and governed data models. Document which platform is authoritative:
- CRM for opportunities
- Billing for revenue generated
- CS tool for health scores
Build common dimensions (account IDs, standardized dates) for reliable joins. RevOps should own the modeling layer and provide curated datasets rather than allowing ad-hoc extracts. This foundation is essential before layering predictive scoring or AI-based forecasts.
Advanced Analytics and AI in Sales Reporting
From around 2022 onward, many B2B teams adopted AI-driven analytics to move from descriptive to predictive reporting, often as part of broader AI sales automation initiatives. This shift improved forecast accuracy by 25% to 40%. Each technique below emphasizes business value, such as better accuracy, higher win rates, and improved prioritization, rather than algorithm details.
Predictive Forecasting and Pipeline Scoring
Models trained on historical sales data (2021-2025) estimate the probability that current deals will close and when. Predictive scoring uses deal age, number of stakeholders, activity patterns, and past conversion rates.
Recommend forecasts comparing traditional roll-up with AI projections. Pilot predictive methods in parallel with existing approaches for several quarters. Even simple rules-based scoring (flags for deals with no activity in 14 days) is a valuable first step toward better forecast accuracy.
Cohort and Lifetime Value Analysis for Better Targeting
Group customers by shared characteristics such as signup quarter, segment, and acquisition channel, and track revenue and churn over time. A cohort report might show 2023 customers with NRR of 112% versus 2024 at 120%, broken down by industry.
This insight feeds sales strategy and qualification. Prioritize cohorts with stronger average deal size and lower churn. Example: customers from a specific partnership channel showing 30% higher expansion over 12 months, identified using AI-powered sales automation and insights.
Funnel Velocity and Deal Acceleration Insights
Funnel velocity measures speed through stages from initial contact to close. Build reports showing median time per stage for different segments (enterprise proposal stage at 22 days versus mid-market at 12).
Identifying slow stages allows targeted enablement, such as better proposal templates if deals stall for more than 15 days. Improved sales visibility into pipeline stages lets you include alerts for deals that exceed typical thresholds. Improving sales cycle length can be a more powerful growth lever than simply adding top-of-funnel leads.
Next-Best-Action Recommendations for Reps
AI and rules-based systems analyze the sales pipeline and suggest which deals reps should prioritize daily, often building on robust sales pipeline health metrics. Surface task lists: “Top 10 at-risk deals to follow up this week.”
Recommendations might suggest specific motions: schedule an executive sponsor call or send a tailored ROI summary. Start by encoding best practices from top sales reps into rules before layering machine learning. Track accuracy and collect feedback to build trust and identify trends.
Scenario Planning and “What-If” Analysis
Advanced sales reporting can simulate outcomes based on changes in win rate, average deal size, or sales volume. Build scenario views for planning: model a 10% win rate increase in North America or reducing sales cycle by two weeks.
Document assumptions clearly within reports. Finance and sales should collaborate on these models, using them to stress-test hiring and marketing investments. These valuable insights inform creating sales reports that support future revenue planning.
How to Build a Sales Reporting Operating Rhythm
Embedding sales reporting into weekly, monthly, and quarterly rhythms transforms reports from after-the-fact exercises into decision-making tools. Without clear cadences, even the best reports go unused.
Daily and Weekly Cadences for Frontline Teams
Reps should use morning dashboards to prioritize outreach based on up to date data, supported by sales activity tracking tools. Managers host weekly 45-minute pipeline reviews using a single shared dashboard, focusing on movement and next steps.
Track weekly health indicators: new opportunities created, key activities completed, pipeline changes. Habit-building around these cadences often matters more than adding new sales metrics.
Monthly Performance Reviews and QBRs
Monthly performance packs combine company’s sales performance, pipeline health, and a look-ahead. QBRs examine trends from the past 90 days: segment performance, win/loss drivers, strategic shifts, and the effectiveness of different sales forecasting methods.
Include sales, marketing, CS, and product in QBRs. Dedicate time to reviewing forecast assumptions versus actual outcomes. This discipline improves data driven decisions over time.
Annual Planning and Target-Setting Process
Historical reports from 2023-2025 feed 2026 target setting. Back-solve from company ARR goals to regional and rep quotas using realistic market trends from past reports, or apply learnings from case studies on how teams close deals faster with Gain.io.
Include scenario planning (base, conservative, aggressive) when presenting to leadership. RevOps should provide standardized planning templates rooted in relevant data from historical analysis.
Governance: Owners, SLAs, and Documentation
Clear governance defines who owns reports, update frequency, and quality expectations. Assign named owners, typically RevOps, to core dashboards with SLAs such as monthly packs delivered by the 3rd business day.
Create internal documentation describing each report’s purpose and filters. Establish request processes for new reports to prevent governance bypass with ad-hoc spreadsheets. Modern sales reporting tools require this structure.
Driving Adoption and a Data-Driven Culture
Reporting matters only if teams trust and use it. Run regular enablement sessions where sales managers walk through dashboards and demonstrate decision-making.
Celebrate wins enabled by report insights, such as pulling forward at-risk deals identified in pipeline health views. Reinforce expectations in performance management, where managers are evaluated partly on forecast accuracy. Over time, teams develop the habit of asking “What does the data say?” before committing to changes that affect sales success.
Sales Reporting Best Practices
This section draws from patterns observed across high-performing B2B revenue teams from 2020-2025. Organizations achieving 110%+ of quota consistently applied data governance and visualization rigor, supported by modern B2B sales CRM systems, with top-quartile teams showing 2.7x better forecast accuracy.
Each subsection covers a specific best practice with guidance on implementation. Examples use concrete metrics like quarterly ARR targets, pipeline coverage ratios of 3-4x, and win rates of 25-30% to keep recommendations actionable. These principles remain tool-agnostic but reference CRMs and BI platforms where it helps visualize implementation.
1. Start With Clear Questions, Not Just Data
Every sales report must originate from 3-5 precise questions. For sales leaders: “Will we achieve Q3 2026 new ARR of $15M at 90% probability?” For RevOps: “Which segments show YoY decline in win rates below 20%?” For executives: “Are rep activities correlating to pipeline generation at 4x coverage?”
Top teams prefix reports with a plain-language summary: “This dashboard answers: 1) Q4 attainment at 87%; 2) EMEA stalls at negotiation; 3) Mid-market growth +22%.”
Question categories to consider:
- Performance vs. target (quota attainment, velocity)
- Pipeline health (coverage ratio, stage distribution)
- Conversion efficiency (stage win rates)
- Territory performance (regional ACV variance)
- Rep productivity (activities per opportunity)
Reports answering more than 5 questions see 40% lower usage. Keep focus tight.
2. Define a Consistent KPI Framework
High-performers maintain a stable set of key performance indicators across months and quarters for comparability. North-star sales performance metrics for SaaS teams like ARR growth (targeting 25-40% YoY) and NRR (110-130% for leaders) anchor strategy.
KPI | Purpose | Target Range |
|---|---|---|
Win Rate | Conversion efficiency | 24-32% |
Pipeline Coverage | Risk assessment | 3-4x quarterly target |
Average Deal Size | Deal quality | Varies by segment |
Sales Cycle Length | Process efficiency | 60-90 days mid-market |
3. Ensure Data Quality and Governance
Inaccurate CRM data undermines 68% of reports. Common issues include 25% of opportunities lacking close dates or 40% assigned wrong stages, highlighting why CRM helps sales teams manage leads and pipeline data accuracy, with errors causing significant forecast slippage annually.
Mandate stage-specific fields:
- Discovery: Source/channel required
- Proposal: Budget, decision-makers (minimum 3), expected close date
30-Day Hygiene Checklist:
- Run deduplication (10% of pipelines are infested)
- Validate opportunity owners
- Standardize stages (6-8 maximum)
- Audit top 20 opportunities manually
- Train reps on win/loss reason logging
Roles matter: sales reps own record accuracy, sales managers own weekly pipeline reviews, RevOps owns system rules and audits. Strong sales deal tracking practices and this governance result in 2x higher trust scores for your sales reports.
4. Align Reports to Specific Audiences and Cadences
Tailoring prevents information overload. Different stakeholders need different views at different frequencies, and many rely on specific sales forecasting methods for accurate revenue planning at each level.
Audience | Report Type | Cadence |
|---|---|---|
Sales Reps | Activity dashboards | Real-time/Daily |
Managers | Pipeline drill-downs | Weekly |
Executives | Trend analysis | Monthly |
Board | Variance analysis | Quarterly |
5. Use Visualizations That Tell a Story
Prioritize intuitive chart types for your sales dashboard:
- Line charts for ARR trends
- Bar charts for segment win rate comparisons
- Funnel charts for conversion analysis
- Waterfall charts for pipeline delta visualization
Every chart needs a “so what” caption: “Mid-market EMEA win rate improved from 21% to 29% in H2 2025, driven by new collateral.” Period-over-period visuals (YoY/QoQ) reveal change rather than static snapshots.
Use consistent color palettes: green for closed-won, red for churn, and blue for open pipeline. Limit dashboards to 5–7 visuals. Story-driven visualizations paired with a visual sales pipeline to improve deal clarity increase insight retention by 50%.
6. Automate Recurring Reports and Dashboards
Automation slashes manual work by 70%. Tools that automate sales tasks to stay focused and organized should target your top time-sinks first:
- Monthly ARR by segment (scheduled BI exports)
- Weekly coverage alerts when below 3x
- Daily activity metrics (self-serve dashboards)
Schedule deliveries, such as a Monday 9 AM leadership email, and use dynamic date filters. Maintain a single source of truth, as 68% of reporting errors come from conflicting spreadsheet versions. The gains are significant, with reps recovering 15% more selling hours when freed from manual reporting process tasks through automated sales workflows.
7. Pair Quantitative Data With Qualitative Commentary
Numbers alone rarely drive change. Monthly and quarterly packs should include “Key Learnings” and “Recommended Actions” sections.
Example commentary: “Q4 2025 competitive loss to Competitor X in 3 enterprise deals due to pricing. Action: Launch pricing enablement Q1 2026, reassign territories.”
Tie metrics to specifics: a win rate dip from 28% to 22% should link to pricing experiments or competitive pressure. Keep it scannable with bullets, as this approach boosts action rates by 40%. A good sales report always explains the “why” behind the numbers.
8. Create a Feedback Loop Around Reports
Effective sales reporting is iterative. Reports should evolve based on how sales teams actually use them in pipeline reviews and QBRs.
Establish quarterly feedback sessions reviewing:
- Dashboard usage metrics (>80% views = keeper)
- Stakeholder survey: “What’s missing? What’s confusing? What’s helpful?”
- Net Promoter target of 50+
Sunset unused reports (typically 20% of any reporting ecosystem). Limit changes to quarterly intervals to maintain familiarity. This disciplined iteration, often supported by a dedicated sales pipeline CRM, leads to 25% better adoption across your entire sales process.
How to Design Core Sales Reports for B2B Teams
These blueprints cover essential recurring reports every B2B sales organization should have by mid-2026. Each features dashboard-first outputs with central visuals and commentary sections. Examples are geared toward SaaS and subscription businesses but adapt to other B2B models.
Quarterly Revenue and ARR Performance Report
This comprehensive sales report summarizes new ARR, expansion ARR, churn, and NRR for a specific quarter versus targets and same-quarter prior year. Example: Q3 2025 new ARR $14M versus $15M target (93%), expansion $4M, churn 6%, NRR 118%.
Layout:
- Headline KPIs at top
- ARR by segment bars (enterprise 60%)
- Average ACV trend line ($120K avg.)
- Revenue mix by product pie chart
The target audience is executive leadership and board. RevOps owns this pack, finalized within the first week after quarter-end. Narrative should explain variance: “Enterprise expansion offset SMB weakness in new business.”
Monthly Sales Performance by Team and Segment
Compare each team’s bookings against quota, broken down by region, vertical, or company size. Example: NA at 105%, EMEA at 92%.
Include:
- Leaderboards with sales rep performance (top rep at 130% pacing)
- Segment charts highlighting growth (fintech vertical +25%)
- Top 10 wins and key losses with competitor notes
This sales performance report supports coaching conversations, showing where reps excel and where support is needed. Sales activity tracking software helps managers use it in monthly all-hands and manager 1:1s to track progress on team’s performance.
Weekly Pipeline Health and Forecast Report
Show total open pipeline for current and next quarter, weighted pipeline value, and pipeline coverage versus target (aiming for 3.5x coverage).
Key elements:
- Stage distribution (discovery, proposal, negotiation percentages)
- Average days in stage to identify trends and detect bottlenecks
- Forecast views: commit, best case, upside
- Flags for deals with slipped dates or no activity in 14+ days
This weekly report is central to pipeline review meetings. Sales leaders using a dedicated sales pipeline CRM for visibility and performance understand exactly where deals stand and can make informed decisions about resource allocation.
Activity and Productivity Report for Reps
Track key motions for SDRs and AEs such as calls targeting 55 per day, meetings at 8 per week, demos, proposals, and follow-up touches. Strong contact management that builds better relationships helps you compare sales activities to outcomes, like meetings to opportunities at a 25% conversion rate, rather than focusing on volume metrics alone.
Update daily or in real-time as a self-serve dashboard. Managers use this in weekly 1:1s to coach on misalignment (many emails but low meeting conversion) and to evaluate whether a CRM with email integration is improving outreach effectiveness. Include goals versus actuals visualization per sales representative for the month.
Win/Loss and Conversion Funnel Report
Analyze conversion rates between each sales funnel stage (lead-to-opportunity at 15%, stage-to-stage rates, opportunity-to-close) and outcomes.
Split results by segment or product to uncover where the process is strong or weak. Include a breakdown of loss reasons:
- Price (28%)
- Timing
- Competition
- Missing features
Perform period-over-period comparisons (H1 2025 vs H2 2025) to measure impact of process changes. This report, combined with disciplined sales deal tracking, drives types of sales reports that feed enablement and product feedback loops.
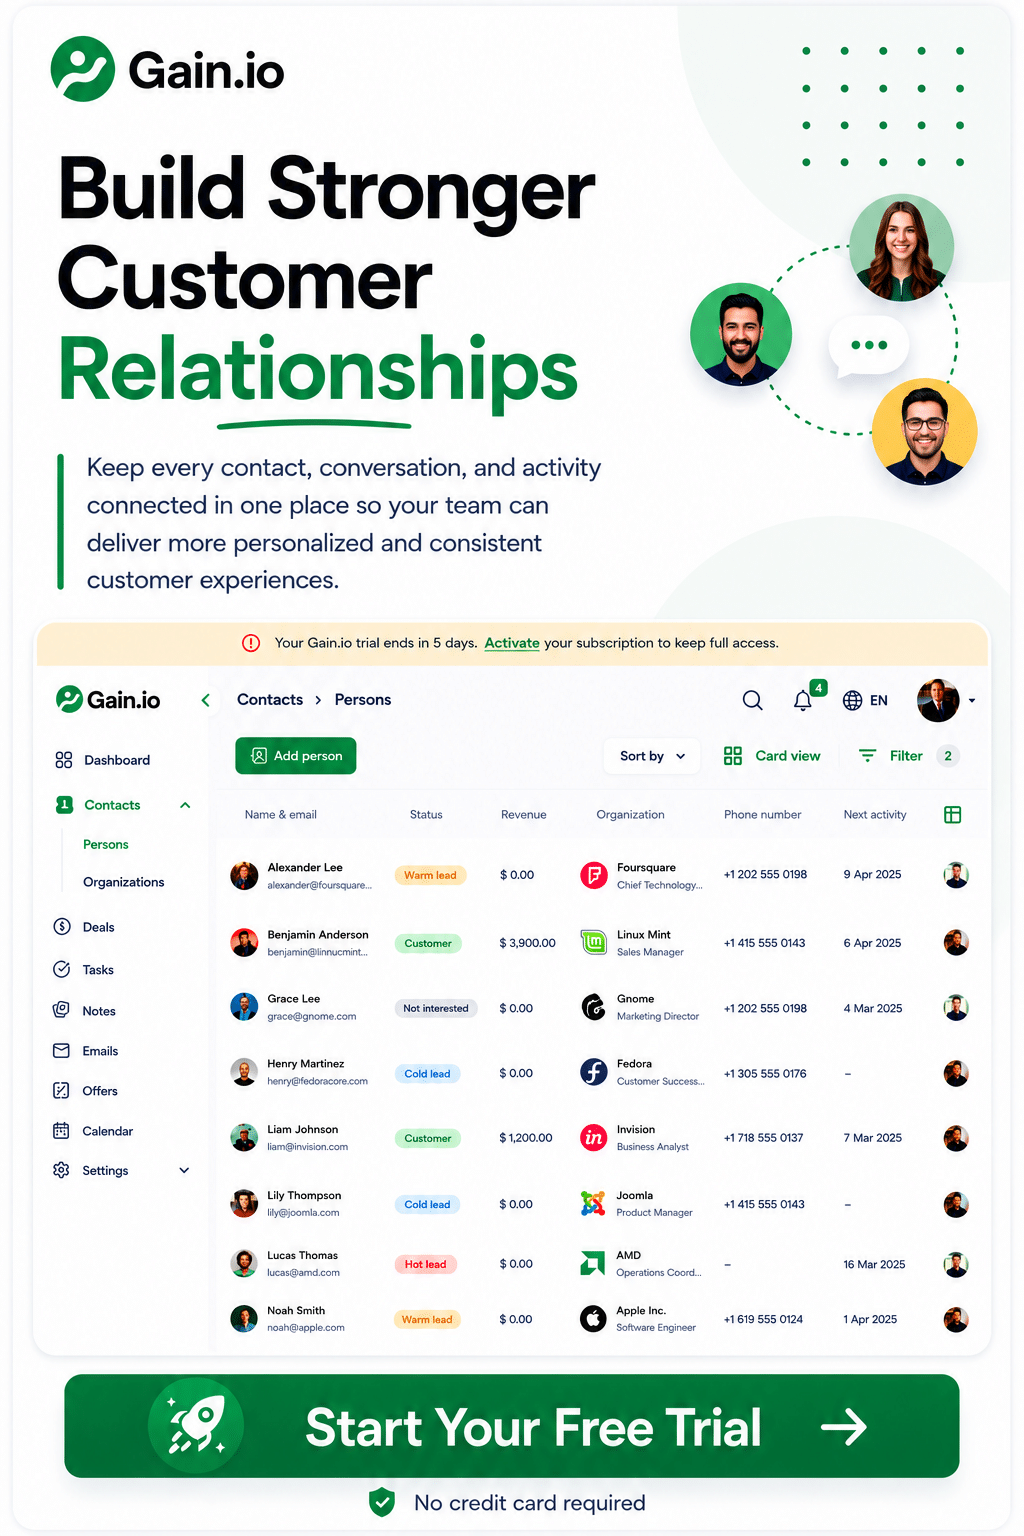
How Gain.io Supports Better Sales Reporting
Gain.io is a collaboration and approval platform that helps marketing and GTM teams coordinate the assets and campaigns sales relies on, with reporting as a central feedback loop. Its workflows make it easier to plan, approve, and track content and campaigns whose performance later appears in sales reports, including product launch collateral, regional campaigns, and sales enablement materials, and they integrate directly with smart CRM tools for sales teams.
By centralizing content planning and approvals, Gain.io ensures that campaigns reflected in sales reporting are well-documented and easy to analyze over time. Teams can use insights from reporting, such as top-performing campaigns, messaging, or assets, to refine future workflows within Gain.io or its all-in-one CRM to grow your sales and team without relying on disconnected tools.
This tight feedback loop between planning in Gain.io and performance in sales reporting helps B2B teams continuously refine go-to-market motions. When your best sales reporting tool connects directly to campaign planning and a simpler sales workflow inside your CRM, you close the loop between what you create and what drives the benefits of sales reporting for your organization.
Frequently Asked Questions
How Often Should We Update And Review Our Sales Reports?
Update core dashboards daily and review weekly for pipeline health. A monthly sales report helps align leadership on trends. A consistent sales reporting process ensures accurate tracking and timely decisions.
What’s The Minimum Data Needed In CRM For Useful Reports?
At minimum, capture key data such as deal stage, pipeline value, close date, owner, and source. Strong customer relationship management practices ensure clean historical data, which improves reporting accuracy and forecasting.
How To Handle Conflicting Numbers Between Sales And Finance?
Align definitions across teams and use a single source of truth within dedicated sales reporting tools. Reconcile revenue generated, bookings, and forecast numbers regularly to avoid inconsistencies in the sales pipeline report.
How To Measure Reporting Impact On Performance?
Track performance using metrics like conversion rates, sales cycle, and forecast accuracy. Compare improvements in sales team's performance and individual sales reps over time. Effective sales reporting plays a key role in identifying trends and improving sales efforts.
What Tools Help Improve Sales Reporting Accuracy?
Use modern sales tools and dedicated sales reporting tools that integrate CRM, billing, and analytics. These platforms support sales management, provide actionable insights, and help sales leaders understand performance drivers clearly.
When is it time to move from spreadsheets to a dedicated reporting stack?
Teams outgrow spreadsheets when they have multiple segments, more than a handful of reps, or when manual creation consumes several hours weekly. Signs include conflicting versions, formula errors, and difficulty answering basic questions quickly. Start with built-in CRM reporting and lightweight BI tools before investing in complex infrastructure, and consider a Gain.io vs Salesforce CRM comparison when choosing your long-term platform.