Sales win rate plays a key role in the entire sales process for B2B growth. Modern sales teams rely on clear data to understand how many deals move from qualified opportunities to closed deals. Sales managers use a win rate calculator to measure average win rate and evaluate team performance. Tracking sales win rate helps identify gaps in the selling process and improve overall sales velocity. Strong insights support better decisions and stronger results across the pipeline.
Improving customer satisfaction and refining each stage of the process can boost outcomes. When sales managers track sales win rate closely, they gain better control over performance and forecasting. A focused approach helps teams close more deals and improve consistency. With better alignment across the entire sales process, organizations can achieve higher win rates and stronger B2B results over time.
What Is Sales Win Rate
Sales win rate is the percentage of opportunities that ended with a signed deal compared with all opportunities that reached a clear decision during a defined period. It answers a fundamental question: of the deals that were actually decided, how many did you win?
The core win rate formula reads: Win Rate equals Won Opportunities divided by (Won Opportunities plus Lost Opportunities) times 100.
Many B2B teams calculate win rate on sales-qualified leads or proposal stage deals specifically. This approach avoids skewing results with very early unqualified leads that were never realistic prospects. When you focus on qualified opportunities, the metric reflects sales effectiveness rather than marketing targeting accuracy.
Sales leaders track win rate at three levels. At the company level, it provides an overall health check. At the team level, comparing regions or segments (say, EMEA versus North America) reveals where processes differ. At the rep level, it identifies who needs coaching and who has winning habits worth sharing with the entire team.
Marketing and revenue leaders also use win rate as a sanity check on targeting and messaging. If qualified prospects convert poorly despite strong pipeline stages, the problem may sit upstream in positioning or campaign themes rather than in sales pitches.
Why Is Your Sales Win Rate Important
Budget pressure and cautious buying committees have made “do nothing” a common decision outcome. In this environment, win rate serves as a health check for both pipeline quality and execution. When buyers scrutinize every purchase and involve more stakeholders, your ability to convert qualified deals separates growth from stagnation.
Small changes in win rate have outsized revenue impact. Take a quarterly pipeline of 200 qualified opportunities with an average contract value of $8,000. At a 25 percent win rate, you generate $400,000. Improve that rate to 35 percent and revenue jumps to $560,000. That is a 40 percent revenue growth from improving conversion alone, without touching lead volume or average deal size.
Tracking win rate month over month helps revenue teams spot problems early. A sudden dip might signal increased discounting, new competitor behaviour, or misaligned messaging from recent campaigns. Catching these shifts quickly lets you course-correct before an entire quarter derails.
Historical win rate data by segment makes revenue forecasting more reliable. Instead of gut-feel projections, you can apply proven conversion rates to current pipeline. If inbound SMB deals close at 32 percent while enterprise deals close at 18 percent, your forecast reflects reality rather than optimism.
For marketing and content operations teams, watching win rate by campaign shows which content themes lead to closed won deals. ROI case studies might outperform feature overviews. Knowing this shapes where marketing and sales efforts should focus.
How To Calculate Sales Win Rate Correctly
Mis-defining what counts as a win and loss can make this metric meaningless. Clear definitions and consistent application matter more than sophisticated tracking tools.
Here is a worked example. In Q1 2026, your team closed 42 deals, lost 108 to competitors or no-decision outcomes, and has 30 still actively progressing. To calculate sales win rate correctly, you use only the 150 decided deals. Divide won opportunities by the sum of won plus lost: 42 divided by 150 equals 0.28. Multiply by 100 for a 28 percent win rate.
Exclude opportunities still active or in nurturing when calculating win rate for that period. Including open deals distorts the metric and makes period-over-period comparison impossible. A deal still in negotiation belongs to a future calculation.
The question of no-decision deals requires a deliberate choice. Some teams count them as losses since the opportunity did not convert to revenue. Others track no-decision as a separate metric to distinguish between losing to competitors and losing to inaction. Choose one approach aligned with your sales cycle and stay consistent over time.
Track at least three flavours of win rate calculation in your B2B sales CRM. Count-based win rate measures deal volume. Value-based win rate weights by revenue, showing if you win the deals that matter. Stage-level conversion rates reveal which parts of your sales funnel leak most, helping diagnose whether problems sit in qualification, demos, or commercial discussions.
Tips For Reliable Sales Win Rate Reporting
Dirty data is the silent killer of win rate accuracy. Stale close dates, opportunities that never move to a decision, and inconsistent status updates make the numbers misleading. Before optimizing win rate, ensure your data reflects reality.
Define reporting periods that match your sales cycle length. For teams with sub-60-day cycles, monthly reporting provides useful feedback loops. For 90 to 180-day enterprise deals, quarterly measurement smooths out natural variation and reveals genuine trends in sales performance.
Create a short definition of done for every opportunity. What exactly triggers a Won status? A signed contract, processed payment, or verbal commitment? What constitutes Lost? A clear “no” from the prospect, selection of a competitor, or explicit postponement? When reps apply these qualification criteria consistently, the entire team works from the same baseline.
Review win rate alongside sales conversion rate metrics to maintain context. Celebrating a higher win rate means little if it comes with a shrinking pipeline. Track number of opportunities created, average deal size, and sales cycle length together. A healthy business shows consistent improvement across multiple dimensions, not isolated metric gains.
Segment from day one. Break down win rate by lead source, industry, and deal size. Inbound content leads might close at 5 to 10 percent from raw lead to customer, while outbound lists convert at 1 to 3 percent. Seeing these differences helps allocate resources where sales efficiency is highest.
What Is A Good Sales Win Rate
There is no universal good win rate, but directional benchmarks help calibrate expectations. Most B2B teams selling software or services see 20 to 30 percent on qualified opportunities. Top performers consistently exceed 35 percent.
Average sales win rates vary by segment:
| Segment | Typical Win Rate Range |
|---|---|
| SMB SaaS | 30-40% |
| Mid-Market | 25-35% |
| Complex Enterprise | 15-25% |
| Professional Services | 30-40% |
Comparing against your own performance history provides more actionable insight than chasing external benchmarks. Create a simple 12-month chart of win rate by quarter. Are you trending up, flat, or declining? A declining win rate quarter over quarter signals systemic issues worth investigating.
External factors legitimately shift your baseline. Entering a new vertical might temporarily lower rates as you learn new buyer needs. Changing pricing affects conversion. Shifting from one-off projects to retainer models changes the buying process. Account for these when evaluating trends.
Set tiered goals. A realistic short-term target might be plus 3 percentage points over two quarters. A longer-term goal ties to a specific revenue plan requiring a certain win rate to hit targets with available pipeline coverage.
Where Sales Win Rate Breaks Down In The Funnel
Win rate is a summary of many smaller conversion decisions, all influenced by your underlying sales workflow optimization. The most useful insight comes from seeing which pipeline stages lose the most deals. Typical B2B stages each have their own mini win rate, reinforcing the value of a well-defined sales process with clear steps:
| Stage | Description | Common Conversion |
|---|---|---|
| Qualification | Confirming fit against clear qualification criteria | Filter poorly qualified opportunities |
| Discovery | Uncovering buyer needs and decision process | Map stakeholders and pain points |
| Evaluation/Demo | Proving solution fit through demonstration | 80% of qualified move forward |
| Proposal/Procurement | Presenting commercial terms | 30-47% become deals |
| Legal/Security Review | Addressing compliance and risk requirements | De-risk the purchase |
| Final Decision | Champion builds internal consensus | Close or lose |
Run a simple diagnostic exercise. Export deals lost in the last 90 days, group by last completed deal stage, and identify the top two drop-off points. This exercise takes an hour and often reveals patterns invisible in aggregate numbers.
Capture a mandatory lost reason in your CRM tied to the stage where the deal died. Over time, this builds a dataset showing whether you lose to competitors, budget constraints, timing issues, or internal priorities. Each pattern requires different fixes in messaging, pricing, or enablement content.
Seven Practical Ways To Improve Sales Win Rate
You cannot hack your way to a healthy win rate. Sustainable improvement requires consistent basics, clarity on who you serve, and a repeatable sales process. Quick fixes might juice numbers temporarily but create problems downstream.
This section covers seven proven strategies: tightening qualification, aligning to the customer journey, improving proposals, reducing response lag, multi-threading stakeholders, using content strategically, and learning systematically from wins and losses. Many of these gains come from thoughtful sales workflow optimization and targeted automation of sales tasks.
Examples focus on B2B teams in software, agencies, and marketing services where buying committees and lengthy approvals are common, especially those experimenting with an account-based selling strategy. Pick one or two strategies to implement per quarter rather than attempting all seven at once. Change fatigue undermines execution.
Some improvements require cross-functional alignment with marketing, product, and legal. Treating win rate as a sales-only problem misses opportunities where collaboration delivers the biggest gains.
Tighten Qualification So You Chase The Right Deals
Over-generous qualification fills the pipeline with deals that were never likely to close. This depresses win rate and burns rep time on opportunities that distract from winnable business.
Define an Ideal Customer Profile with concrete traits. Industry, company size, tech stack, and buying triggers (teams expanding to new regions, launching new product lines, or replacing legacy systems) create a clear picture of who you serve best. When sales reps know the profile, they pursue qualified deals rather than any deal.
Choose a simple qualification framework like BANT or MEDDIC and customize questions for your actual sales motion. Generic templates waste time. Your questions should surface real buying signals specific to your solution and market.
Establish a practical rule: no opportunity advances past qualified unless the rep has confirmed budget ownership, timeline, and at least one success metric stated by the prospect. This discipline prevents premature pipeline inflation.
Tightening qualification may initially shrink pipeline count. Stay the course. Within one to two quarters, you should see noticeably higher win rate and reduced sales cycle length as reps focus on prospects ready to buy.
Align Your Sales Process With The Modern Buyer Journey
Buyers expect to research quietly, move between channels, and involve colleagues before engaging sales directly. Meeting them where they are improves win rates more than forcing them through rigid sequences.
Map your current sales stages to typical buyer actions: internal discovery, vendor shortlist creation, evaluation workshops, and procurement review. Understanding where buyers spend time helps you support their buying process rather than interrupt it.
Replace rigid sequences with flexible plays that respond to buyer behaviour. When a stakeholder mentions a specific use case, send a tailored case study. When finance joins calls, shift to ROI discussions. Adaptability signals partnership rather than pressure.
Role-based demos outperform one-size-fits-all presentations. Showing marketing teams how campaigns flow, operations teams how approvals work, and finance teams how costs compare creates relevance that generic feature tours cannot match.
Make it easy for buyers to self-serve between calls. Short explainers, ROI calculators, and implementation timelines give champions ammunition for internal discussions when you are not in the room.
Strengthen Proposals And Commercial Discussions
Many strong opportunities die at proposal stage because value, scope, or risk was not clear enough for the buying committee. Your proposal speaks for you in rooms you never enter.
Start proposals by restating the prospect’s own words about problems and success criteria. When buyers see their language reflected back, they feel understood. Features and line items come second.
Include a comparison of three options: stay as-is with current risks, patch with manual processes and their costs, or partner with your team and the outcomes that follow. Plain language about risks and costs over 12 to 24 months frames your solution as the obvious choice.
Make pricing transparent and directly tied to outcomes buyers care about. Campaigns approved per month, assets delivered on time, or reduction in revision cycles connect investment to value rather than presenting abstract line items.
Build a small internal library of proposal sections, case studies, and ROI examples. Reps should assemble professional quotes quickly instead of reinventing every proposal from scratch.
Respond Faster At Critical Moments
Response time is often the hidden lever of win rate, especially in competitive deals where prospects compare multiple vendors in the same period. Speed signals commitment and capability.
Track two specific metrics: time to first response for new inquiries and average response time to in-cycle questions near proposal and legal review stages, then use CRM follow-up automation to keep responses fast and consistent. These moments shape buyer perception most.
Create simple internal agreements. New demo requests get a human response within two business hours. Proposal redlines receive feedback within one business day. These commitments become part of your sales culture.
Build a central knowledge hub with approved answers to common questions on security, integrations, onboarding, and pricing. Reps respond accurately without waiting on specialists, eliminating delays that cause prospects to lose interest.
Small improvements around contract and approval stages can determine whether you win deals in Q2 or lose to a faster competitor.
Multi Thread Your Deals And Involve Stakeholders Early
Most B2B decisions now involve 6 to 10 stakeholders. Relying on a single champion makes deals fragile. When that person changes roles, goes on leave, or loses internal influence, your opportunity collapses.
Map stakeholders explicitly: economic buyer, day-to-day users, influencers in legal, IT, and operations, and potential internal champions from different departments. Know who matters before the final decision stage.
Use practical tactics like joint discovery calls that include both end users and a budget owner. Short workshops where multiple teams see how your solution fits their workflows build broad support that single-threaded deals lack.
Early involvement of legal or procurement surfaces non-negotiable requirements before the final week. Knowing about security questionnaires or contract term limits early prevents last-minute delays that hurt win rate and extend sales cycle length.
Multi-threading also protects deals from internal changes. When your relationship spans multiple stakeholders, organizational shifts do not automatically mean lost deals.
Use Content Strategically To Support Every Stage
Relevant, timely content moves buyers from interest to conviction, especially in long, committee-driven decisions, and a strong sales pipeline CRM helps you deliver that content at the right moments. The right asset at the right moment removes friction that otherwise stalls progress.
Pair each sales stage with specific assets. One-page overviews support discovery conversations. Detailed workflow walkthroughs fit evaluation phases. ROI examples help finance stakeholders justify the investment. Stage-matched content shows you understand the buying process.
Work closely with marketing or content operations to build a sales content menu tagged by stage, industry, and use case, then plug it into a simpler CRM-driven sales workflow so reps can access it quickly. When reps can find the right piece quickly, they spend time selling rather than searching.
Consistently sharing implementation plans and approval checklists with prospects has proven to shorten cycles and increase the proportion of proposals that reach signed status. Buyers appreciate clarity about what comes next.
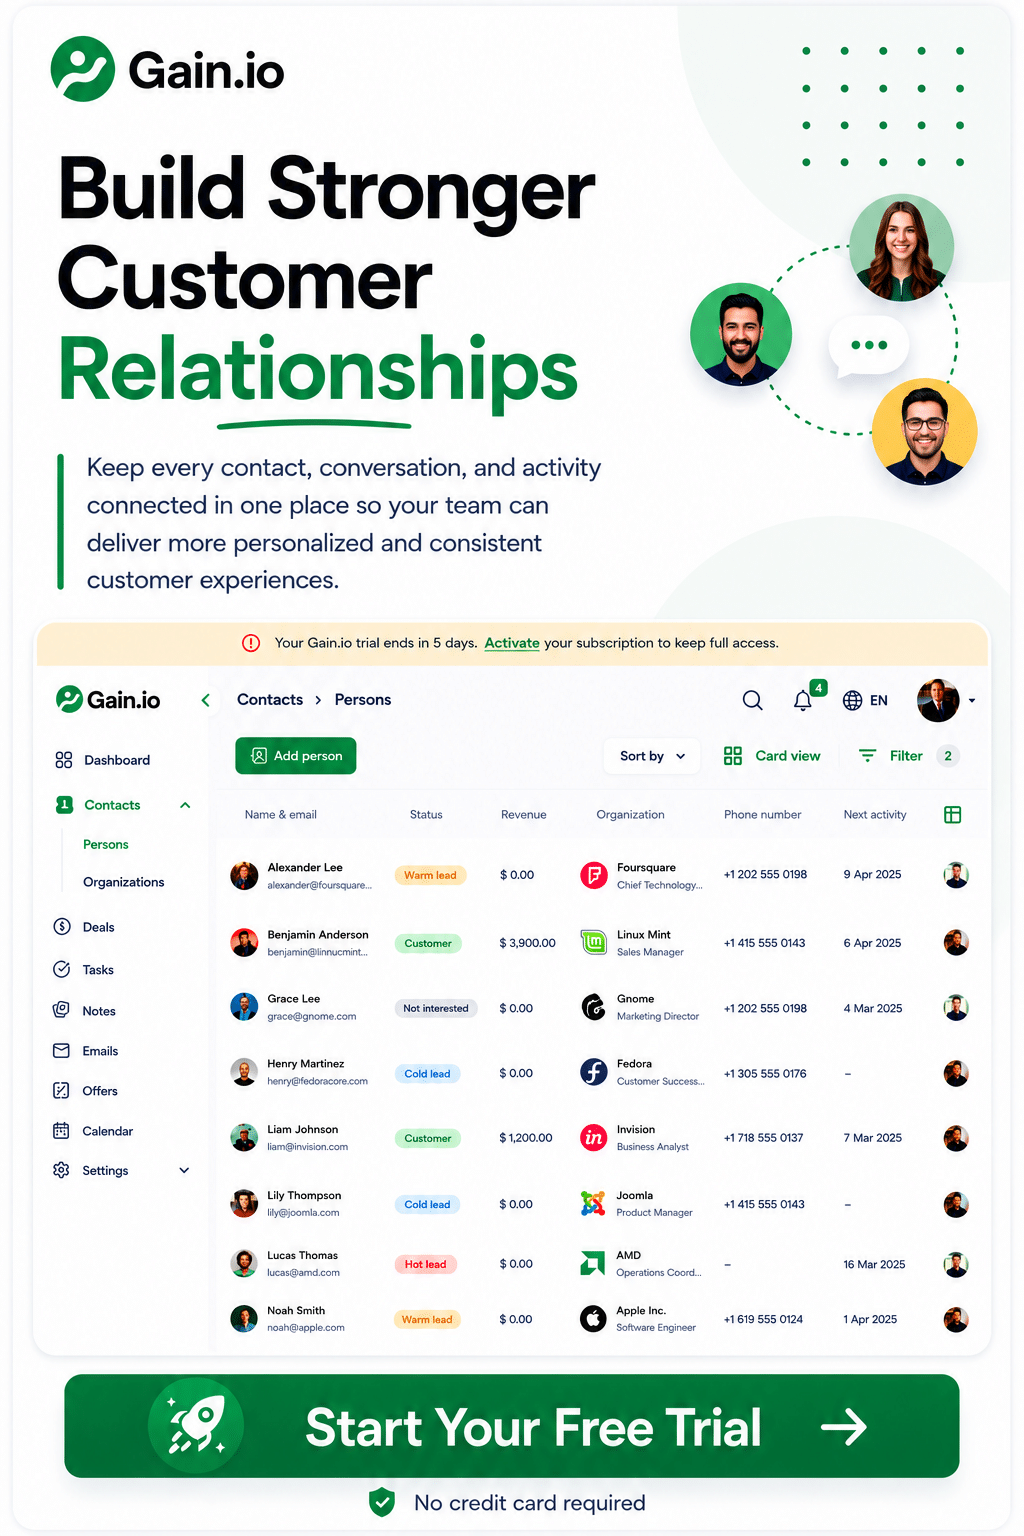
Operational platforms like Gain.io make it easier for marketing teams to keep these assets updated and approved so sales always presents current, on-brand material.
Learn Systematically From Win Loss Analysis
Without structured win loss analysis, teams attribute results to isolated anecdotes rather than patterns they can act on. Systematic learning turns every outcome into improvement fuel.
Capture standard fields on every closed deal: primary win or loss reason, main competitor, decision type (chose you, chose competitor, no decision), and which content or campaign first touched the account; this CRM data is the foundation for improving sales productivity. This data builds over time into actionable patterns.
Run recurring monthly or quarterly reviews where sales, marketing, and leadership examine patterns together. Choose one improvement experiment to run each cycle. Consistent small improvements compound into significant win rate gains.
Occasional direct interviews with both won and lost customers provide depth that CRM fields cannot capture. A neutral person asking specific questions about selection criteria and perceived vendor differences surfaces insights that reshape messaging and qualification criteria.
Over time, this process leads to sharper positioning, more accurate win rate criteria, and steady improvements rather than isolated fixes, similar to the compounding impact seen in a sales acceleration case study.
How Gain.io Supports Higher Sales Win Rates
While Gain.io is not a CRM, its smart CRM-style tools for sales teams improve win rate by fixing a frequent hidden problem in B2B sales: slow, inconsistent approval of marketing and sales assets. When campaigns slip and content sits in revision limbo, sales teams lack the materials they need to win deals.
Marketing, brand, and content teams use Gain.io to centralize campaign assets, manage approvals with clients or internal stakeholders, and keep everything version-controlled and on time—benefits that complement an all-in-one CRM to grow your sales. Clear workflows replace chaotic email chains and confusing feedback loops.
This connects directly to sales success. Timely, consistent campaigns generate better-qualified inbound leads. Well-governed content gives sales teams credible, on-brand collateral for every stage of the customer journey. When a rep needs a case study, product deck, or implementation timeline, it exists, and it is current, supported by stronger contact and relationship management.
Consider a distributed brand team preparing a product launch. Using Gain.io to keep reviews on schedule means field sales teams receive final decks, one-pagers, and social assets weeks before launch rather than scrambling at the last minute.
By reducing revision loops, clarifying who approves what, and keeping campaign timelines visible, Gain.io helps businesses run smoother go-to-market motions that support higher conversion rates and stronger win rates over time, especially when paired with robust sales pipeline CRM practices and disciplined lead management in a CRM.
Frequently Asked Questions
Should I Include No Decision Deals In My Win Rate
Classic win rate calculation uses only opportunities that ended in a clear win or loss. However, many sales organizations track a separate no decision rate for deals that stalled or were postponed indefinitely. Treat no decision as a distinct outcome in your CRM. This visibility shows whether you lose mostly to competitors or to buyer inaction. Each scenario requires different fixes. Losing to competitors suggests positioning or feature gaps. High no-decision rates point to weak urgency creation or misaligned timing.
How Often Should My Team Recalculate Win Rate
Most B2B teams with 30 to 90 day cycles should review win rate monthly, then run a deeper analysis quarterly to smooth out short-term noise, a rhythm that works particularly well for startups and small sales teams using CRM. Monthly reviews catch emerging problems. Quarterly analysis reveals true trends. Very long enterprise cycles may need quarterly or semi-annual measurement, while high-velocity inside sales teams with sufficient deal volume can track weekly. The key is maintaining enough closed deals per period to produce stable, meaningful numbers.
Is It Possible To Game Win Rate And Hurt Growth
Focusing only on the percentage can lead sales reps to avoid competitive deals or over-disqualify sales opportunities. This might inflate win rate while shrinking total revenue. A rep showing 45 percent win rate on 20 deals contributes less than one showing 25 percent on 80 deals. Balance win rate with pipeline coverage, opportunity volume, and average deal size. Together, these metrics reveal whether improvements reflect healthier sales or just safer choices.
What Is The Difference Between Win Rate And Close Rate
Win rate focuses on decided opportunities only, comparing wins versus losses among deals that concluded, a view your CRM should make obvious, whether you choose an enterprise platform or a simpler Gain.io vs Salesforce CRM setup. Close rate sometimes refers to the percentage of all leads or opportunities that eventually become paying customers, a definition that also matters for organized retail teams using CRM tools. Win rate measures how effective you are at converting serious opportunities once they enter your pipeline. Close rate helps diagnose top-of-funnel and qualification health by looking at the entire journey from lead to customer.
How Can Marketing Teams Use Win Rate Data Day To Day
Marketers can segment win rate data by first-touch campaign, content theme, or channel. This reveals which activities bring in opportunities that actually close, not just those that generate clicks or signups. Feed these insights back into planning. Budget should flow toward campaigns generating high-win-rate deals, even if they produce fewer leads overall, and your CRM with email integration should surface which touchpoints actually influence those wins. Quality matters more than quantity when your goal is revenue growth, whether you are running a B2B SaaS team or coordinating real estate agents with CRM tools.