Your sales pipeline tells a story. The question is whether you are reading it correctly. In 2026, with average sales cycle length stretching to 90 days for mid-market B2B SaaS deals, relying on gut instinct to predict revenue is a losing strategy. Research from Salesforce shows that sales teams actively managing pipeline health metrics achieve 18 percent higher win rates and 28 percent more accurate forecasts.
Gartner notes that high-performing organizations conduct weekly health reviews using structured criteria, while average teams settle for monthly subjective checks. The difference shows up in results, especially when leadership has strong sales visibility into real-time pipeline metrics. Teams with 3x coverage of healthy pipeline consistently outperform those with 5x poor-quality volume. These numbers make one thing clear. Pipeline health is not just a nice metric to track. It is the foundation of revenue predictability.
What Are Pipeline Health Metrics
Pipeline health metrics are specific indicators that show whether your current open pipeline can support the next one to three quarters of revenue, not just this month’s close. These sales pipeline metrics look at both quantity, like pipeline coverage and total opportunities, and quality, including fit, engagement levels, and win likelihood across all deal stages.
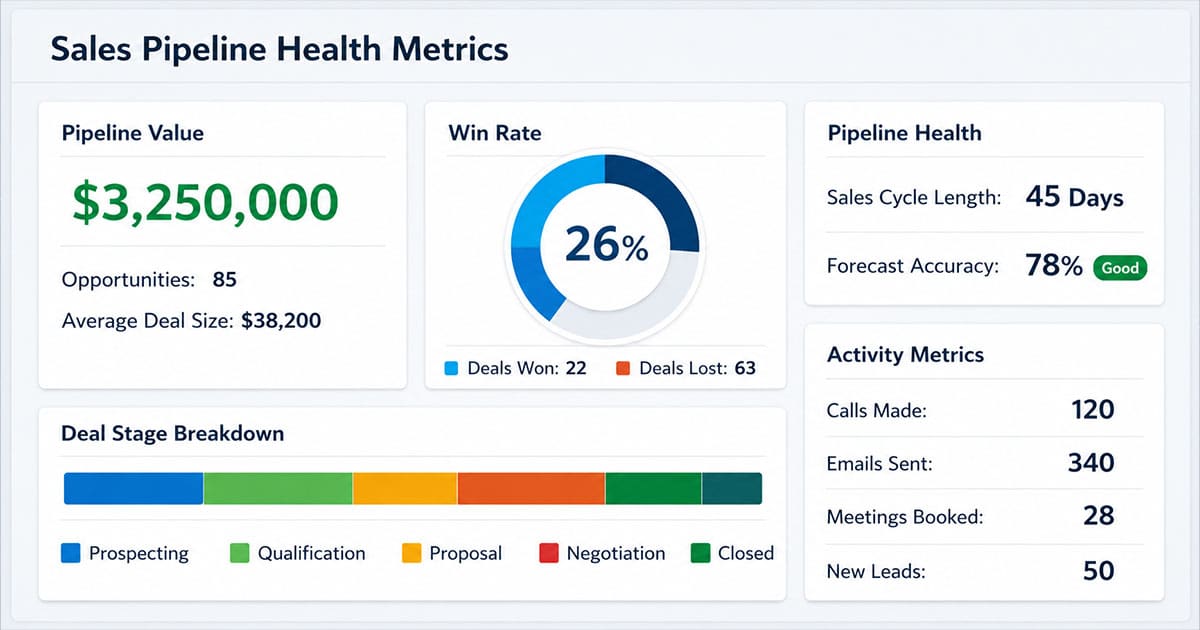
A B2B SaaS company selling mid-market deals in 2026 might review pipeline health at the start of each month by dividing total pipeline value by quarterly quota. But focusing purely on that number is misleading without context. You also need conversion rates, deal age, and stage duration to get a clear picture. A total pipeline of $3 million against a $1 million goal looks great until you realize half those deals have stalled for 90 days.
Why Pipeline Health Metrics Are Important In 2026
Revenue teams depend on accurate pipeline insights to forecast performance and manage opportunities effectively. Strong pipeline health metrics sit alongside broader sales KPIs for smarter revenue decisions to help organizations understand deal movement, evaluate sales effectiveness, and adapt strategy when market conditions change.
Revenue Alignment With Pipeline Metrics
Pipeline health metrics play a direct role in helping companies achieve revenue goals. Sales leaders rely on key sales pipeline metrics such as win rate, pipeline coverage, and deal velocity to estimate whether revenue targets are achievable.
A clear view of the sales funnel allows leadership teams to assess how opportunities move toward closed deals. When the pipeline lacks sufficient opportunities or deal value, sales teams can adjust outreach strategies and generate more deals before the quarter ends.
Deal Quality Assessment Across Opportunities
Deal quality provides a deeper understanding of whether opportunities in the pipeline represent real buying intent. Sales teams often focus on quantity rather than evaluating whether prospects are qualified.
Strong pipeline management emphasizes quality leads and realistic opportunities that align with the company’s ideal customer profile. Reviewing deal quality helps organizations avoid wasting resources on weak prospects and strengthens forecasting accuracy.
Deal Progression Visibility Across Stages
Deal progression metrics reveal how opportunities move through different stages of the sales process. Monitoring progression helps identify where deals slow down or stall before reaching later stages.
If many opportunities remain stuck in one stage, the sales organization can analyze possible causes such as pricing concerns or product fit issues. Faster progression across stages improves sales velocity and increases the likelihood of closing deals within the expected timeline.
Predictive Insights For Revenue Forecasting
Predictive analytics plays a growing role in modern revenue planning. Predictive metrics analyze historical pipeline performance to estimate future outcomes.
Sales leaders use predictive analytics to identify patterns that influence deal success. These insights allow teams to adjust strategy early and support data driven decisions based on real performance trends instead of assumptions.
Strategic Planning With Pipeline Analysis
Pipeline analysis provides a comprehensive metric framework for evaluating overall pipeline health. By reviewing pipeline trends regularly, sales teams gain insights into how opportunities perform under different market conditions.
Cohort analysis helps organizations compare groups of opportunities created in different time periods. This method highlights which strategies produce more deals and how quickly deals move through the pipeline, complementing your choice of sales forecasting methods for accurate planning. Such insights allow teams to refine key sales strategies and strengthen long term pipeline performance.
Major Pipeline Health Metrics To Track
This section covers a focused set of metrics most teams should track weekly and monthly. Names and exact formulas vary by company, but the underlying ideas stay consistent across regions, products, and segments. Pick five to eight of these to feature on your main dashboard and use a quarterly quota of $1 million with a 90-day average sales cycle as reference points.
Pipeline Coverage Ratio
Pipeline coverage ratio divides total open pipeline value by the sales target for that period. If you have $3 million in pipeline against a $1 million Q2 goal, that equals 3x coverage. For stable mid-market SaaS in 2026, 3x is the benchmark. Early-stage companies or those with low historical win rates need higher ratios, sometimes 4x to 5x. Slice coverage by team and segment to spot if you are over-reliant on a few enterprise deals. Align calculations with CRM close date fields and ensure old slipped deals do not inflate the ratio artificially.
Pipeline Velocity
Pipeline velocity shows the rate at which pipeline turns into revenue over time. The formula uses number of opportunities times average deal size times win rate divided by average sales cycle length in days. For example, 40 opportunities at $20,000 average amount, 25 percent win rate, and 60-day cycle yields roughly $166,000 in monthly revenue potential. Compare velocity month over month and by segment to see where deals move quickly and invest in disciplined sales deal tracking for modern teams. Even a small improvement in win rate or sales cycle length can significantly lift deal velocity and impress finance teams.
Stage Conversion Rates
Stage-to-stage conversion shows the percentage of opportunities that move from one step to the next. Track the full funnel from qualified opportunity through discovery, demo, proposal stage, negotiation, and closed won deals, ideally using custom sales stages tailored to each team. If conversion from proposal to close falls from 40 percent in Q1 2025 to 25 percent in Q1 2026, that reveals issues with pricing stories or competitors. Use this metric in your weekly sales meeting to choose one stage per quarter to improve systematically.
Deal Age And Stage Duration
Deal age counts days since an opportunity was created. Stage duration tracks average time opportunities sit in specific stages like evaluation or procurement. Flag any mid-market deal older than 75 days in negotiation or 45 days in proposal review. Color-code dashboards or use a visual sales pipeline to improve deal clarity and highlight stalled deals that distort forecasts. Use these metrics to trigger automated reminders or honest closing of dead opportunities.
Win Rate By Segment And Owner
Win rate should be sliced by segment, product line, and deal owner rather than a single blended percentage. If one rep closes 32 percent in UK manufacturing while the team average is 18 percent, share their approach. Sudden win rate drops serve as early indicators of pipeline health issues, often appearing before coverage falls. Keep definitions consistent with opportunity qualification rules so the metric stays trustworthy.
Lead Quality And Qualification Metrics
Marketing qualified lead to sales qualified lead conversion tracks handoff success between teams. A fall from 30 percent to 18 percent MQL to SQL conversion after a new campaign launch signals targeting problems. Modern teams rely on CRM tools to help manage leads effectively alongside frameworks like BANT or MEDDIC to improve lead quality, and you will strengthen every other pipeline health metric over two to three quarters.
Forecast Accuracy Over Time
Forecast accuracy measures how close predicted revenue was to actual results, sitting alongside other critical sales performance metrics for SaaS teams. If your team forecast $900,000 and closed $1,050,000, that 14 percent error erodes trust in pipeline health reporting. Track accuracy trends over at least four to six quarters by region. Use forecast misses to refine stage probabilities and pipeline hygiene practices rather than blaming individuals. Target 85 to 90 percent accuracy over time.
How To Diagnose Pipeline Health Problems
Diagnosis starts with recognizing that something is off. Weekly signals save quarters when caught early. Compare current metrics with baselines from 2024 and 2025 to understand whether changes are seasonal, macro-driven, or unique to your sales process.
Spotting Early Warning Signals
Watch for sudden drops in stage conversion rates, spikes in average deal age, or more late-stage slippage into the next quarter. Track these indicators weekly and flag them in a single slide that leadership can review in under 10 minutes. One team noticed a slowdown at demo stage in February and refreshed enablement content by mid-March, saving the quarter. Lost opportunities often signal issues before coverage metrics reflect them.
Separating Coverage Issues From Quality Issues
An unhealthy pipeline can come from too few opportunities or too many low-quality ones. The fix differs for each. Compare pipeline coverage ratio against win rate and deal age. If coverage is 4x but win rate is down and deal age is rising, the priority is tightening qualification rather than adding more qualified leads at the top. Revenue operations can build a simple sales pipeline CRM view to visualize this comparison for leadership.
Reading Bottlenecks In Stage Duration
Line up average days in stage over three to six months to see where deals stall. If proposal stage duration increased from 8 days to 19 days over two quarters, update pricing guidelines and proposal templates. Consider external factors like new procurement policies at large customers. The goal is identifying what to change in your sales process for tracking deals from lead to close as soon as a bottleneck is confirmed.
How To Improve Pipeline Health With Practical Actions
Knowing metrics means nothing without turning insights into habits. These actions can be implemented within a quarter and quickly deliver cleaner forecasts and breathing room for your team focus.
Strengthening Qualification And Discovery
The fastest way to improve pipeline health score is being stricter at the top of the funnel about which opportunities enter at all. Set non-negotiable entry criteria for the first qualified stage, such as confirmed budget range, identified champion, and target go-live timing. Run short role-play sessions focused on qualifying out politely and early. One firm cut pipeline 20 percent but improved win rate by more than 10 points over two quarters. These habits support a scalable sales process for growing teams, and better coaching opportunities at discovery protect all downstream metrics.
Instituting Regular Pipeline Hygiene Routines
Implement a weekly 30 to 45 minute pipeline review and a deeper monthly clean-up for stale deals. Auto-close opportunities with no meaningful customer interaction for 30 days unless the owner documents a reason. Add fields for next step and expected close date so deals without clear progress cannot sit indefinitely, and make sure every rep works from a visual sales pipeline tool to manage deals. These routines and disciplined sales deal tracking practices quickly improve deal age metrics and build trust in coverage numbers.
Aligning Sales, Marketing, And Customer Success
Pipeline health belongs to the entire go-to-market team. Misalignment shows up as poor lead quality, slow onboarding, or weak expansion. Hold a monthly revenue council meeting that reviews shared metrics like MQL to SQL conversion and expansion pipeline coverage. Create feedback loops where sales shares which campaigns generate qualified opportunities and customer success highlights great expansion fits.
Using Automation And Playbooks
Automation helps maintain pipeline health by triggering reminders when deals cross age thresholds. Build stage-specific playbooks outlining best next stage actions and stakeholder engagement. Automated alerts for stalled proof of concept opportunities led one team to earlier executive involvement and shorter cycles. Use automation to support thoughtful outreach, not generic messages, and look for CRM setups that offer a simpler sales workflow to get more from your CRM plus email integration to streamline sales communication.
How To Design A Pipeline Health Dashboard
A well-designed dashboard pulls the most important metrics into a single view. Leaders and front-line managers should be able to scan it in minutes and spot patterns that need attention, especially when it is grounded in a clear understanding of what a sales pipeline is and how to build one.
Choosing Metrics For The Main View
Core metrics for the top-level dashboard include pipeline coverage, sales velocity, stage conversion, deal age, and forecast accuracy for the active quarter. Depending on business model, add customer acquisition cost or lifetime value. Limit the main view to 8 to 10 metrics so leaders can quickly spot patterns. Document definitions next to each chart to keep everyone aligned on what good pipeline health score means and where smart CRM features for sales teams can automate data collection.
Creating Views For Different Stakeholders
Sales reps need personal pipeline coverage, deal age, and conversion rates, often delivered through a focused sales pipeline CRM view that improves visibility. Executives need quarter-over-quarter trends and capacity planning views. A monthly pack for board meetings should highlight three pipeline health trends and a short narrative about risks and mitigations. Even specialized roles like real estate agents benefit from CRM tools that help them save time. Sophisticated dashboards still need to be simple enough for regular use by your entire sales team.
Setting Review Cadence And Ownership
Establish weekly team reviews, biweekly leadership sessions, and quarterly pipeline summits to plan the next six to twelve months. Assign clear owners for each metric so someone investigates anomalies and drives improvements. Document decisions and action items from each review directly in your dashboard tool. Consistent cadence and ownership matter more than perfect metric selection for improving overall pipeline health over time.
How Gain.io Supports Strong Pipeline Health
Gain.io brings pipeline health visibility to sales teams through unified dashboards that integrate CRM data for coverage ratios, velocity trends, and stage conversions in real time. As an all-in-one CRM to grow your sales and team, the platform helps your sales organization track how many deals move through different stages without manual exports or scattered spreadsheets.
Users report 25 percent gains in forecast accuracy and 15 percent velocity improvements matching 2026 benchmarks. One B2B SaaS startup even used Gain.io to close deals faster with a standardized, data-driven pipeline. With filtering by segment and product line, you get balanced views that reveal where to adjust strategy for hitting revenue targets, while integrated contact management helps you manage contacts better and build stronger relationships. Gain.io lets you close deals faster by keeping your entire team aligned on pipeline health metrics that matter.
Frequently Asked Questions
How Often Should We Review Pipeline Health Metrics
Weekly reviews work best for active quarter metrics like pipeline coverage, velocity, and deal age. Add a monthly deeper dive covering next quarter and beyond. Quarterly benchmarking sessions help adjust targets and stage probabilities based on recent sales performance. Consistency matters more than perfect timing. Pick a cadence your team can maintain all year, whether that is a Monday morning check-in or a Friday afternoon review.
Which Pipeline Health Metric Should We Fix First
Start with the metric that most directly affects revenue in the next 90 days. This is often stage conversion rates or deal age in late stages rather than top-of-funnel volume. Run a quick impact analysis by asking what happens to booked revenue if that single metric improves by a small amount. Focus energy there for one or two quarters before tackling other areas. Avoid big simultaneous overhauls since they make it hard to tell which change delivered results.
How Can Small Teams Track Pipeline Health Without Dedicated RevOps
Start with a simple CRM dashboard tracking coverage, win rate, and average deal age. Even basic views showing stagnant percentage under 20 percent provide valuable insights. Schedule a recurring 60-minute monthly session to review numbers, clean up stale deals, and adjust priorities. As headcount grows and data volume increases, investing in more advanced tooling like a sales pipeline CRM to improve visibility and performance or a platform built around a simpler sales workflow that maximizes CRM value becomes worthwhile. The key is starting with the right metrics rather than waiting for perfect systems.
What Is A Reasonable Target For Forecast Accuracy
Many modern B2B teams consider forecasts within plus or minus 10 to 15 percent of actuals to be strong results. Early stage companies or those with concentrated enterprise deals may see more variability. Focus first on improving data quality and stage definitions before tightening targets. Track accuracy trendlines across several quarters, with 85 to 90 percent accuracy being a reasonable goal after four quarters of consistent health-adjusted forecasting.