Many businesses invest in a CRM system expecting better sales performance, stronger customer relationships, and higher revenue. Yet many teams struggle to understand whether their CRM investment is actually delivering measurable results. A CRM ROI calculator helps businesses evaluate the financial impact of their CRM by measuring revenue growth, operational efficiency, and cost savings.
For every sales team, understanding CRM ROI is essential. It shows whether the system is improving productivity, increasing conversions, and reducing manual work. An ROI calculator can also reveal opportunities to optimize processes and maximize returns.
This guide explains how to measure costs, revenue, and efficiency using a CRM ROI calculator. You will learn which metrics matter most, how to calculate CRM ROI, and how to determine whether your CRM system is generating real business value.
What Is CRM ROI
CRM ROI measures the return on investment a business receives from its CRM investment. It compares the financial benefits generated by the CRM system against the total cost of purchasing, implementing, and maintaining it. CRM return can come from higher revenue, better productivity, improved customer retention, and reduced operational costs.
Measuring return on investment gives businesses an accurate picture of whether their CRM is creating real value. A positive CRM ROI shows that the investment is contributing to business growth, while a lower return may indicate areas that need improvement.
The Real CRM ROI Formula And Variables
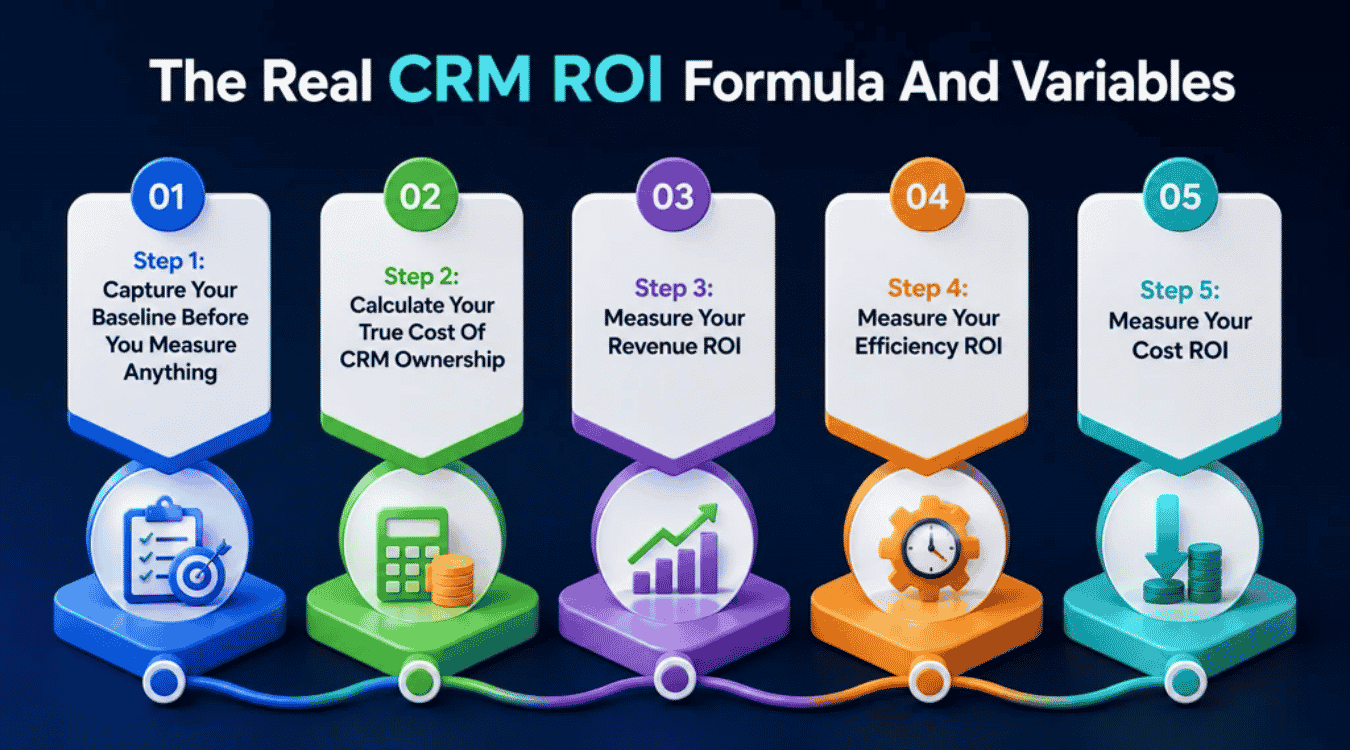
A CRM ROI calculator is only as accurate as the numbers behind it. To calculate return correctly, businesses need to measure costs, revenue growth, efficiency gains, and operational savings. A structured approach helps teams evaluate the true impact of their CRM investment.
Step 1: Capture Your Baseline Before You Measure Anything
Before implementing a CRM, document your current performance metrics. Without baseline data, it becomes difficult to calculate returns or prove improvements.
Metrics To Document Before Go-Live
Record important business metrics such as:
- Lead conversion rate
- Average deal value
- Sales cycle length
- Revenue per sales rep
- Customer retention rate
- Customer acquisition cost
- Administrative hours per rep
Why Skipping Baseline Kills Your ROI Calculation
Many companies expect their CRM to increase revenue, but they never record previous performance. Without historical data, teams cannot determine whether improvements came from the CRM, market conditions, or other factors. Baseline metrics provide the accurate picture needed for long-term ROI analysis, especially when you want to prove changes, such as a 37% reduction in sales cycle time, from a structured CRM rollout.
Step 2: Calculate Your True Cost Of CRM Ownership
Many businesses consider only subscription fees when evaluating CRM costs. Total ownership costs often extend far beyond software licenses.
Direct Costs
Direct expenses include:
- CRM subscription fees
- User licenses
- Implementation costs
- Data migration
- Initial training
Ongoing Costs
Recurring expenses include:
- Monthly subscriptions
- User onboarding
- System administration
- Support services
- Additional integrations
Hidden Costs
Hidden costs can affect ROI calculations significantly. Common examples include:
- Employee training time
- Temporary productivity loss
- Custom development work
- Data cleanup projects
- Third-party tools
Worked Example: 10-Person Team Full 12-Month Cost Picture
A company with 10 sales representatives paying $25 per user per month spends $3,000 annually on licenses alone. Adding onboarding, training, integrations, and administration costs may increase total CRM ownership to $7,000 or more during the first year, which is why choosing CRM tools that fit your workflow and budget is critical before you commit.
Step 3: Measure Your Revenue ROI
Revenue growth remains one of the biggest benefits of a CRM system.
Close Rate Improvement
Better lead tracking and follow-up often improve closed-won opportunities. If a sales team increases its close rate from 20% to 25%, the additional deals directly contribute to CRM ROI.
Sales Cycle Length Reduction
Shorter sales cycles allow representatives to manage more opportunities throughout the year, increasing revenue potential.
Average Deal Size Increase
Better customer data and sales insights help teams identify upsell opportunities and larger deals.
Customer Retention Impact
Retaining existing customers often generates more revenue than acquiring new ones. Strong customer relationships contribute to long-term business growth.
Step 4: Measure Your Efficiency ROI
Efficiency improvements often produce immediate value.
Hours Saved Per Rep From Automation
Automated tasks reduce manual work and allow sales representatives to focus on selling, especially when they automate sales tasks to stay focused and organized through workflows and smart reminders.
Lead Response Time Improvement
Faster responses improve customer engagement and increase conversion opportunities.
Reduced Tool Overlap And Data Entry Cost
Many companies use multiple disconnected tools. A centralized CRM reduces duplicate work and improves data accuracy, especially when it includes CRM with email integration to streamline sales communication.
How To Convert Time Savings Into A Dollar Figure
If a sales rep saves five hours per week and earns $30 per hour, the company saves approximately $7,800 annually for that employee. For a 10-person team, efficiency gains can create substantial cost savings.
Step 5: Measure Your Cost ROI
Reducing expenses is another important part of CRM ROI.
Customer Acquisition Cost Reduction
Better lead management helps businesses generate more qualified opportunities while spending less money on acquisition, particularly when teams understand how CRM helps sales teams manage leads from first touch through closed-won.
Customer Churn Cost Reduction
Improved customer relationships reduce churn and protect recurring revenue.
Consolidated Tooling Savings
Many companies replace several disconnected applications with one CRM platform. Lower software costs and reduced complexity contribute directly to the overall ROI of the business.
Your CRM ROI Scorecard: A Before-And-After Calculator
A CRM ROI scorecard helps businesses compare performance before and after CRM implementation. Instead of relying on assumptions, it uses measurable business data to evaluate the actual impact of the CRM. Tracking the same metrics over time gives leadership a clearer understanding of revenue growth, efficiency gains, and cost savings.
The scorecard should include baseline performance, current results, percentage changes, and financial impact. Common metrics include close rates, sales cycle length, average deal value, customer retention, and administrative hours, and it becomes even more useful when paired with a simpler sales workflow that gets more from your CRM.
Example CRM ROI Scorecard
Metric | Before CRM | After CRM | Business Impact |
|---|---|---|---|
Close Rate | 18% | 24% | More closed deals |
Sales Cycle | 45 Days | 32 Days | Faster revenue generation |
Average Deal Value | $5,000 | $5,750 | Higher revenue per sale |
Lead Response Time | 10 Hours | 2 Hours | Better conversion potential |
Admin Time Per Rep | 10 Hours/Week | 5 Hours/Week | Productivity gains |
Before CRM Revenue: $900,000
After CRM Revenue: $1,380,000
Revenue Increase: $480,000
The same team also saved roughly 50 administrative hours every week. At an average labor cost of $30 per hour, that represents nearly $78,000 in annual productivity savings.
This type of before-and-after calculator provides a more scientific method for evaluating CRM ROI because it focuses on measurable business outcomes rather than assumptions or software features.
Which Metrics Affect CRM ROI
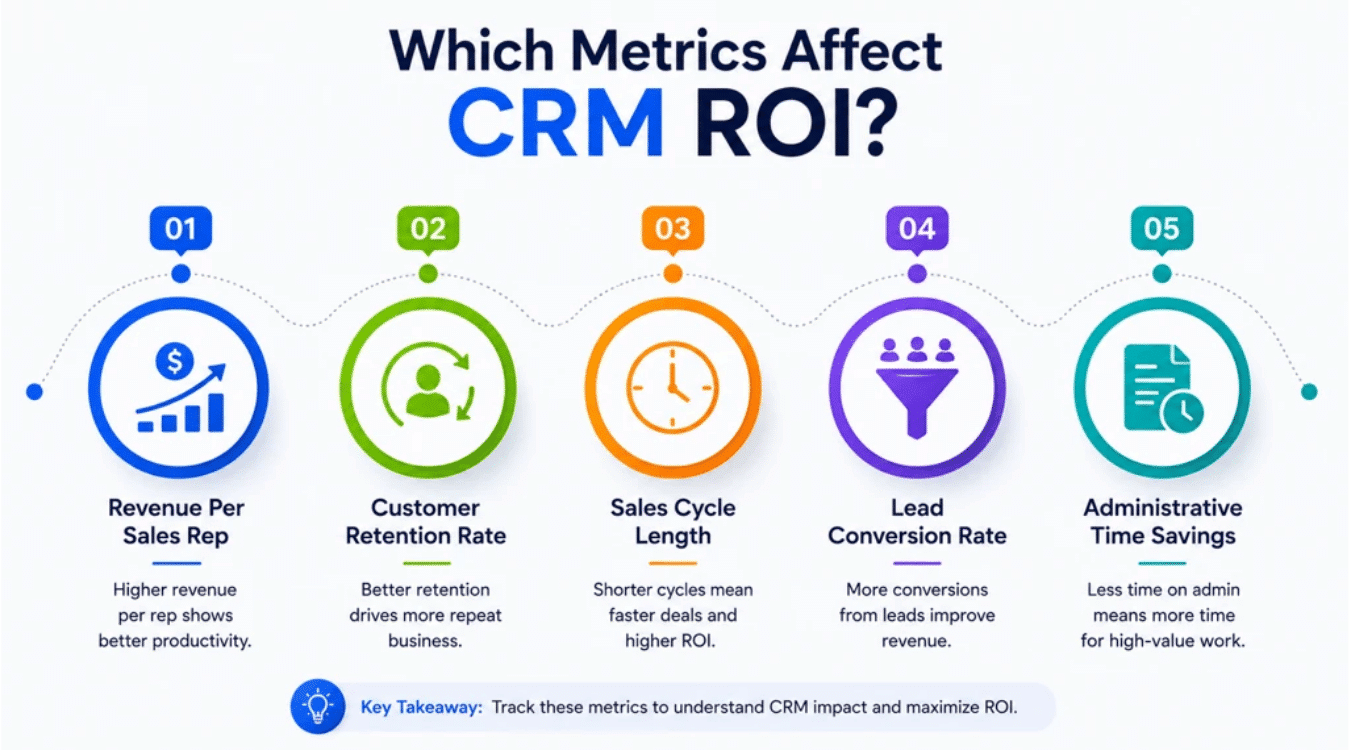
A CRM investment delivers value only when performance can be measured consistently. Tracking the right metrics helps businesses calculate ROI, manage improvements, and identify areas where the CRM creates measurable savings and revenue growth.
Revenue Per Sales Rep
Revenue per sales representative measures how much income each salesperson generates over a specific period. This metric helps companies evaluate whether implementing a CRM improves productivity and sales performance.
For example, if a representative generates $50,000 monthly before CRM adoption and $65,000 afterward, the additional revenue contributes directly to ROI. Revenue per rep is often presented as a benchmark when evaluating sales efficiency, especially when combined with a sales pipeline CRM to improve visibility and performance.
Customer Retention Rate
Customer retention rate shows the percentage of customers who continue doing business with the company over time. Higher retention creates long-term value because retaining existing customers typically costs less than acquiring new ones.
A CRM helps teams manage customer relationships, track interactions, and identify risks before customers leave. Small improvements in retention can generate substantial financial gains when you manage contacts better and build stronger relationships in a centralized system.
Sales Cycle Length
Sales cycle length measures the time required to convert leads into customers. Shorter sales cycles allow teams to close more deals and generate revenue faster, particularly when you invest in sales pipeline management that improves deal visibility.
For example, reducing the average sales cycle from 50 days to 35 days allows representatives to handle more opportunities annually. Faster deal movement also improves cash flow and forecasting accuracy.
Lead Conversion Rate
Lead conversion rate measures the percentage of leads that become paying customers. This metric is commonly calculated by dividing converted leads by total leads.
A CRM helps sales teams track lead details, automate follow-ups, and prioritize opportunities. Better lead management often creates higher conversion rates and additional revenue gains with an all-in-one CRM to grow your sales and team.
Administrative Time Savings
Administrative tasks such as data entry, reporting, and manual updates consume valuable selling time. CRM automation reduces repetitive work and creates measurable savings.
If a sales representative saves five hours every week, the annual time savings can be converted into a financial value based on salary costs. Reduced administrative work also lowers training requirements and allows teams to focus on generating revenue instead of managing spreadsheets or updating multiple systems, especially when they use task management for sales teams to improve deal execution.
CRM ROI Benchmarks By Company Size In 2026
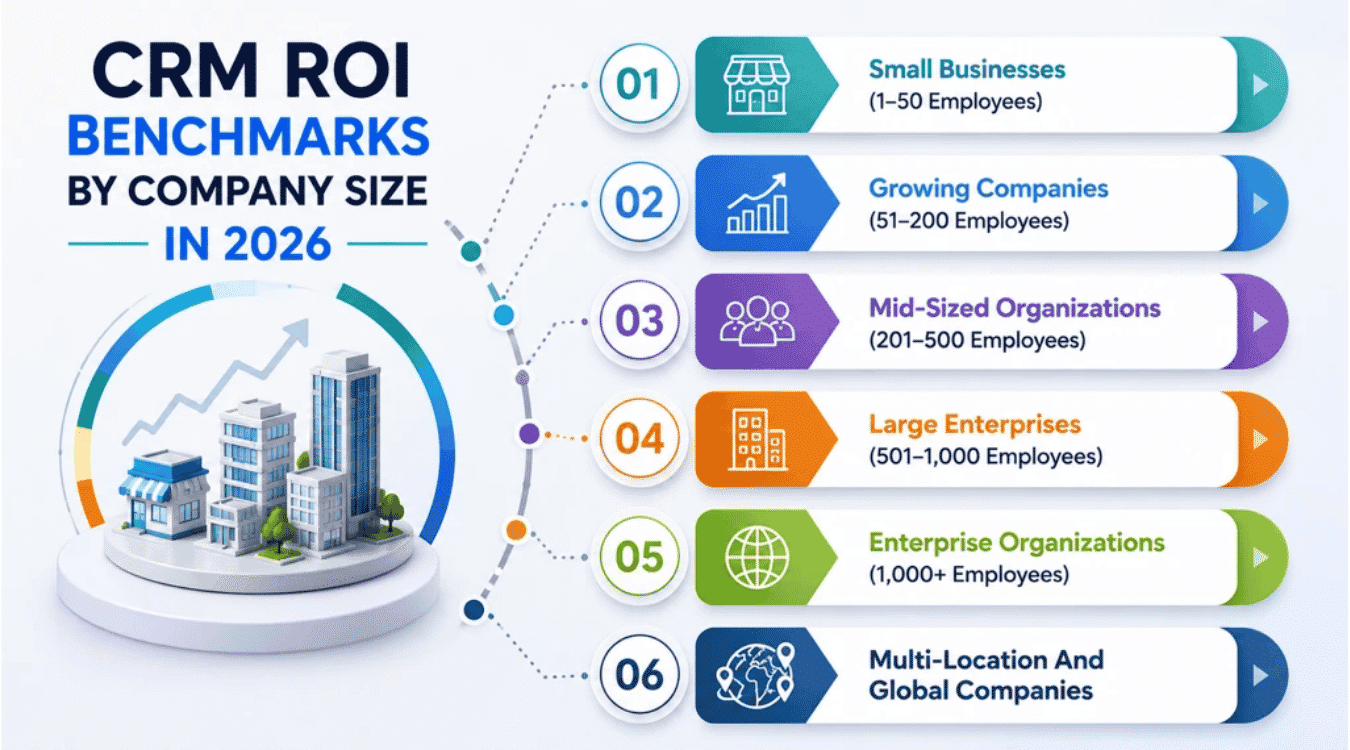
CRM ROI varies by company size because implementation costs, sales processes, and operational complexity differ across organizations. The following benchmarks help businesses identify realistic expectations and evaluate CRM performance against companies with similar structures.
Small Businesses (1–50 Employees)
Small businesses often see faster returns because implementation costs are lower and teams can adopt the system quickly. CRM ROI typically comes from better lead management, improved follow-up, and reduced manual work, which are core benefits of a CRM for startups and small sales teams.
Average Benchmark: 20% to 80% ROI within 12 months.
At this stage, the key point is controlling costs while improving sales productivity.
Growing Companies (51–200 Employees)
Growing businesses usually implement CRM systems to standardize processes and manage larger sales teams. Revenue growth and operational savings become more applicable metrics.
Average Benchmark: 40% to 120% ROI within 12 to 18 months.
Companies should identify improvements in conversion rates, sales efficiency, and customer retention.
Mid-Sized Organizations (201–500 Employees)
Mid-sized organizations often require deeper integrations, user training, and process changes. The CRM formula becomes more complex because multiple departments access the system and depend on smart CRM tools for sales teams to coordinate activity and reporting.
Average Benchmark: 50% to 150% ROI over 18 to 24 months.
Complete ROI calculations should include operational costs, retention improvements, and revenue growth.
Large Enterprises (501–1,000 Employees)
Large organizations depend on CRM systems to improve collaboration, reporting, and pipeline visibility. Multiple teams often provide input into the CRM, making data quality critical.
Average Benchmark: 60% to 180% ROI within two years.
A single performance metric cannot guarantee success. Multiple KPIs must be measured together.
Enterprise Organizations (1,000+ Employees)
Enterprise companies invest heavily in automation, integrations, and advanced analytics. ROI calculations must consider productivity gains, operational control, and customer experience improvements, as well as whether a simpler platform like Gain.io vs Salesforce CRM is a better fit for specific sales teams.
Average Benchmark: 75% to 250% long-term ROI.
The system often delivers value through efficiency and scalability rather than immediate revenue increases.
Multi-Location And Global Companies
Global businesses use CRM platforms to manage distributed teams, regional sales operations, and customer data across multiple markets.
Average Benchmark: 80% to 300% ROI over multiple years.
The most accurate way to evaluate CRM ROI is to compare current performance against historical benchmarks, measure consistent improvements, and calculate results using the same formula over time.
Why Your CRM ROI Is Disappointing And How To Fix It
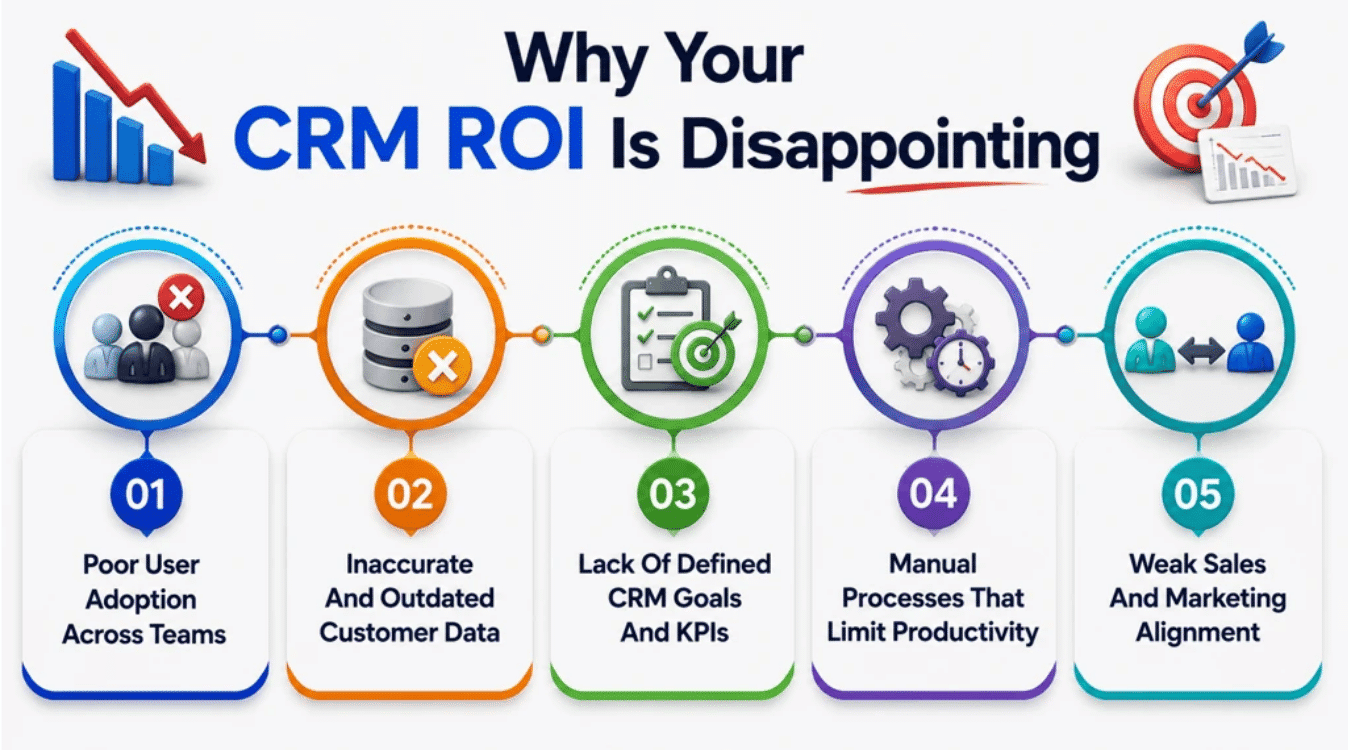
Many businesses invest in a CRM expecting immediate results, but disappointing ROI is a typical outcome when adoption, data quality, and processes are overlooked. Identifying the root cause helps teams improve performance and increase their return.
Poor User Adoption Across Teams
Low adoption is one of the biggest reasons CRM projects fail. Sales representatives may continue using spreadsheets, personal notes, or separate tools instead of updating the CRM. As a result, managers cannot track opportunities or understand actual pipeline performance.
How To Fix: Create clear usage standards, provide regular training, and monitor adoption weekly. Team leaders should refer to CRM reports during meetings so that employees understand that the system is the primary source of information. Small wins during the first few weeks often improve long-term adoption.
Inaccurate And Outdated Customer Data
Duplicate records, missing information, and outdated contact details reduce CRM accuracy. Poor data quality affects forecasting, reporting, and customer communication, making it difficult to measure results accurately.
How To Fix: Establish data entry rules and perform regular audits. Teams should update customer records after every interaction and remove duplicate entries. Many companies schedule monthly data reviews to maintain accurate information and improve reporting.
Lack Of Defined CRM Goals And KPIs
Some organizations implement CRM software without defining what success looks like. Without specific goals, businesses cannot track progress or evaluate return, and they often underestimate how CRM adoption challenges and best practices affect overall ROI.
How To Fix: Define measurable KPIs before implementation. Common metrics include lead conversion rates, closed-won deals, customer retention, and revenue per sales representative. Every department should understand which results the CRM is expected to deliver.
Manual Processes That Limit Productivity
Sales teams often spend hours updating records, preparing reports, and managing repetitive tasks. Manual work reduces productivity and limits the value of the CRM, especially when notes and activities are scattered instead of managed in notes and activity tracking software for sales teams.
How To Fix: Explore automation opportunities for lead assignment, follow-up reminders, and reporting. Platforms such as HubSpot and other modern CRM systems use workflow automation to reduce administrative work. Saving even a few hours each week can improve productivity and increase ROI.
Weak Sales And Marketing Alignment
Sales and marketing teams frequently work in separate categories with different goals. Marketing may generate leads that sales teams cannot convert, creating friction and poor performance.
How To Fix: Establish shared goals and common reporting dashboards. Both teams should track lead quality, conversion rates, and revenue contribution. Regular meetings help break communication barriers and create better alignment between departments.
How To Present CRM ROI To Leadership
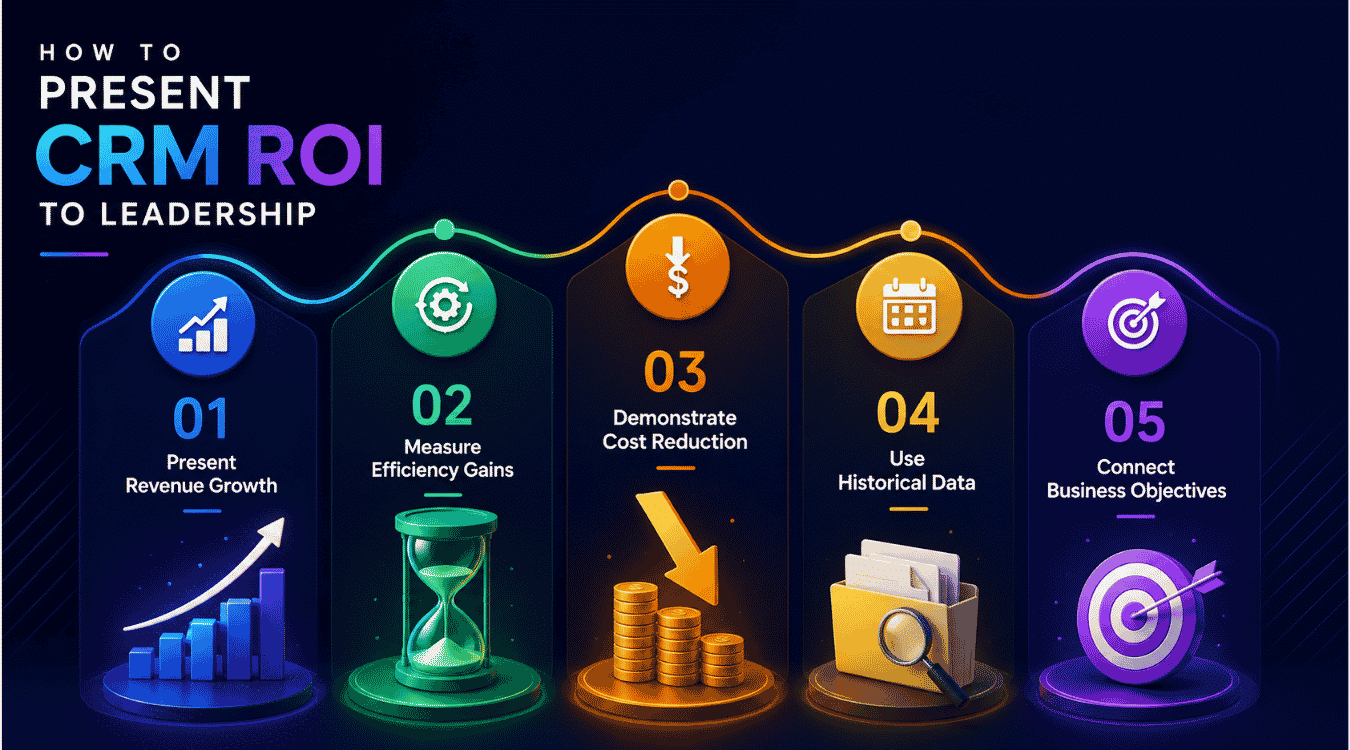
Leadership teams want to understand how CRM performance affects revenue, efficiency, and business growth. Presenting CRM ROI effectively requires clear metrics, measurable outcomes, and business-focused insights. A structured approach helps decision-makers evaluate the potential return of their CRM investment.
Present Revenue Growth
Revenue remains the most important metric for executives. Leadership teams want to know how the CRM contributes to closed deals, customer retention, and overall business growth.
Present revenue increases using before-and-after comparisons. Show how sales performance changed after implementation by highlighting improvements in conversion rates, average deal values, or monthly revenue. Industry benchmarks can also help leadership understand whether performance aligns with market expectations.
Measure Efficiency Gains
Efficiency improvements often provide immediate value even before significant revenue growth appears. Reduced administrative work, faster follow-ups, and improved sales processes create measurable benefits.
Calculate the number of hours saved each week through automation and workflow improvements. Converting saved time into labor costs helps leadership understand the financial impact. Demonstrating productivity gains gives executives a clearer picture of the CRM's return.
Demonstrate Cost Reduction
Lower operating costs contribute directly to CRM ROI. Businesses often reduce software expenses, manual processes, and customer acquisition costs after implementing a CRM system.
Present cost reductions using clear financial figures. For example, eliminating duplicate tools or reducing administrative workloads provides measurable savings. Leadership teams respond better to actual numbers than assumptions or future hope.
Use Historical Data
Historical performance data provides context for CRM results. Comparing current metrics with previous performance allows leadership to identify measurable improvements.
Present key metrics such as sales cycle length, close rates, lead conversion rates, and customer retention over multiple periods. Historical trends also help validate whether results come from the CRM or external market conditions. Accurate data builds confidence in the analysis.
Connect Business Objectives
CRM metrics should always support larger business goals. Leadership teams focus on growth, profitability, customer experience, and operational performance rather than software features.
Connect CRM outcomes to strategic objectives such as increasing revenue, improving customer retention, entering new markets, or supporting website lead generation. When CRM performance directly supports business priorities, executives can better understand the value of the investment and evaluate its long-term potential return, including whether a platform like Gain.io vs Pipedrive CRM aligns best with those objectives.
How Gain.io Helps Businesses Maximize CRM ROI
Gain.io helps businesses improve CRM ROI by bringing contacts, deals, activities, and customer information into one platform. Sales teams can track opportunities, manage pipelines, and monitor follow-ups without switching between multiple tools.
The platform helps reduce manual work through task management, activity tracking, and workflow automation. Better visibility into deals allows teams to identify bottlenecks, improve follow-up consistency, and increase sales productivity by acting as a focused sales pipeline CRM that improves visibility and performance.
Gain.io also supports collaboration by keeping customer details, notes, and sales activities accessible in a centralized system. This helps businesses maintain accurate data and make better decisions while benefiting from sales pipeline management that enhances deal control.
By improving pipeline visibility, reducing administrative work, and helping teams manage opportunities more effectively, Gain.io enables businesses to measure performance and maximize the return on their CRM investment.
Frequently Asked Questions
How Long Does It Take To See Positive CRM ROI?
Most businesses begin seeing measurable CRM ROI within 6 to 18 months. The timeline depends on user adoption, training, process improvements, and sales cycle length. Companies with clear goals and consistent usage often achieve results faster.
Does A Higher CRM Price Guarantee Better ROI?
No. Expensive software does not automatically deliver better results. CRM ROI depends on how effectively the sales team uses the system, the quality of customer data, and the processes built around the platform.
Can Small Businesses Use A CRM ROI Calculator?
Yes. Small businesses can benefit significantly from a CRM ROI calculator because it helps measure revenue growth, cost savings, and productivity improvements. Even teams with a few sales representatives can track performance and evaluate their investment.
Which Costs Should Be Included In CRM ROI Calculations?
Businesses should include software subscriptions, implementation costs, user training, integrations, support expenses, and administrative costs. Including both direct and indirect expenses provides a more accurate view of total CRM investment.
How Often Should CRM ROI Be Measured?
Most organizations review CRM performance quarterly or every six months. Regular evaluations help businesses identify trends, track improvements, and make adjustments before problems affect revenue or customer relationships. Consistent measurement also provides better long-term ROI analysis.