Revenue growth rarely fails because of effort. Revenue growth fails because pipeline metrics stay unclear. Research shows that companies with accurate sales forecasting are 10% more likely to grow year over year and twice as likely to lead their industry. Yet nearly 67% of sales organizations lack a formal forecasting process. That gap damages forecast accuracy, pipeline health, and revenue targets.
Strong sales pipeline metrics reveal how many deals move through the sales funnel, how much revenue sits in the open pipeline, and whether the pipeline coverage ratio supports the sales target. Metrics like win rate, average deal size, average sales cycle length, and sales velocity show if qualified leads convert into closed won deals.
In this article, you will learn the most important sales pipeline metrics, how to measure pipeline quality, how to improve conversion rates, and how to build a data driven sales strategy that delivers consistent revenue expansion.
What Is Pipeline Metrics
Pipeline metrics are measurable indicators that show the health and performance of your sales pipeline. Sales pipeline metrics help a sales team understand how many deals are in the open pipeline, how much pipeline value exists, and whether pipeline coverage supports revenue targets. Research shows that organizations with structured sales forecasting processes are significantly more likely to achieve their sales goals. Yet many sales organizations still lack consistent pipeline reviews.
Important sales pipeline metrics include win rate, average deal size, average sales cycle length, sales velocity, and pipeline coverage ratio. These numbers reveal how many qualified leads convert into closed won deals and how many days a typical sales cycle takes. Clear metric tracks help sales managers improve lead quality, boost conversion rates, increase forecast accuracy, and generate revenue with confidence.
How Revenue Targets Shape Your Pipeline Plan
Revenue targets shape every part of your sales pipeline. A clear sales target tells you how much revenue you must close and how many deals you need in the open pipeline. Research shows that companies with structured sales goals are 3.5 times more likely to outperform peers. Pipeline metrics connect those goals to daily sales execution.
Start With Clear Revenue Targets
A revenue target is more than a number. It defines how many closed-won deals your sales team must secure. If your annual target is $1 million and your average deal size is $25,000, you need 40 closed deals. That number sets the direction for your sales organization.
Clear sales goals also improve focus. Sales managers can measure total sales against forecasted revenue every month. Teams with defined targets report up to 30% higher sales performance compared to teams without structured planning. You can see better results with sales performance metrics.
Calculate Required Pipeline Coverage
Pipeline coverage ratio shows whether your total pipeline can support revenue targets. Many B2B teams aim for 3x to 5x pipeline coverage. If your quarterly target is $250,000, you may need $750,000 to $1.25 million in total pipeline value.
Strong pipeline coverage protects forecast accuracy. Low coverage signals risk. Excess pipeline with poor lead quality signals weak qualification. Balanced coverage improves sales forecasting and reduces surprises at the end of the sales cycle.
Align Deal Size With Sales Goals
Average deal size directly impacts how many deals you must close. A higher average deal reduces pressure on the number of opportunities. Enterprise accounts often increase deal size and customer lifetime value.
If your average deal is small, your sales team must close more deals to hit the same revenue target. That increases workload and sales cycle pressure. Strategic focus on larger qualified opportunities improves revenue efficiency and pipeline quality.
Match Sales Cycle Length To Forecast
Sales cycle length determines how fast revenue converts. A long average sales cycle delays forecasted revenue and increases uncertainty. Research shows that B2B sales cycles can range from 30 to 120 days depending on deal size and complexity.
Accurate knowledge of average sales cycle length improves sales forecasting. Sales managers can predict how many days it takes to move from initial contact to closed deal. Shorter cycles increase sales velocity and strengthen pipeline health.
Set Conversion Benchmarks For Growth
Win rate and stage conversion rates reveal whether the scalable sales process supports revenue expansion. The typical win rate in B2B ranges from 15% to 30%. If conversion rates drop, pipeline value alone cannot save revenue targets.
Strong conversion benchmarks improve lead quality and identify deals that deserve focus. Sales reps can prioritize qualified leads instead of chasing all the deals. Clear benchmarks support data-driven decisions and create predictable revenue growth.
Core Pipeline Metrics Every Business Must Track
Strong pipeline metrics turn guesswork into clear direction. Every sales team needs visibility into pipeline value, deal velocity, and conversion rates. Research shows that companies with data driven sales processes achieve up to 5–10% higher revenue growth than peers. Clear sales pipeline metrics improve forecast accuracy, pipeline health, and overall sales performance.
Pipeline Coverage Ratio
Pipeline coverage ratio shows whether your open pipeline can support revenue targets. Many B2B sales organizations aim for 3x to 5x coverage. If your quarterly sales target is $500,000, you may need $1.5 million or more in total pipeline value.
Low pipeline coverage creates revenue risk. Excess pipeline with poor lead quality creates false confidence. Sales managers must review pipeline coverage during pipeline reviews to protect forecasted revenue and maintain accurate forecasts.
Win Rate
Win rate measures how many closed won deals you secure compared to total closed deals. The typical win rate in B2B ranges from 15% to 30%, depending on industry and deal size.
Higher win rate improves sales performance without adding more leads. Strong qualification improves conversion rates and pipeline quality. Sales reps who focus on qualified opportunities close more deals and waste fewer resources on lost deals.
Sales Velocity
Sales velocity shows how fast revenue moves through your sales pipeline. It connects number of opportunities, average deal size, win rate, and sales cycle length. Faster pipeline velocity increases total sales without increasing headcount.
If your sales cycle length drops by even 10%, revenue arrives sooner. Shorter cycles also improve cash flow. High performing SaaS companies monitor pipeline velocity weekly to ensure steady deal movement across pipeline stages.
Average Deal Size
Average deal size impacts how many deals your sales team must close to hit revenue targets. Larger average deal reduces pressure on number of opportunities. Enterprise accounts often increase both deal size and customer lifetime value.
Smaller average deal requires more closed won deals to meet the same sales goals. Sales strategy should align with ideal customer profile and right prospects. Balanced deal size improves pipeline efficiency and revenue expansion.
Sales Cycle Length
Sales cycle length measures number of days from initial contact to closed deal. Research shows B2B average sales cycle can range from 30 to 120 days depending on complexity and industry.
Long sales cycle delays forecasted revenue and increases uncertainty. Clear understanding of average sales cycle length helps sales forecasting and planning. Sales managers can adjust pipeline coverage ratio when cycle extends beyond normal range.
Stage Conversion Rates
Stage conversion rates track how deals move through the sales funnel. Weak conversion between proposal stage and closed deal signals process issues. Strong stage metrics improve pipeline health and lead quality.
Sales organizations that monitor stage performance identify deals that stall. Focused coaching improves sales conversion rates and win rate over time. Clear pipeline stages and consistent qualification improve overall sales outcomes.
Pipeline Value And Aging
Pipeline value represents total revenue potential in the open pipeline. However, value alone does not guarantee success. Aging deals often signal risk. Deals that remain too long in one stage reduce forecast accuracy.
Sales teams must track how many deals sit beyond normal sales cycle length. Regular pipeline reviews help identify deals at risk of becoming lost deals. Healthy pipeline aging improves predictability and supports stable revenue growth.
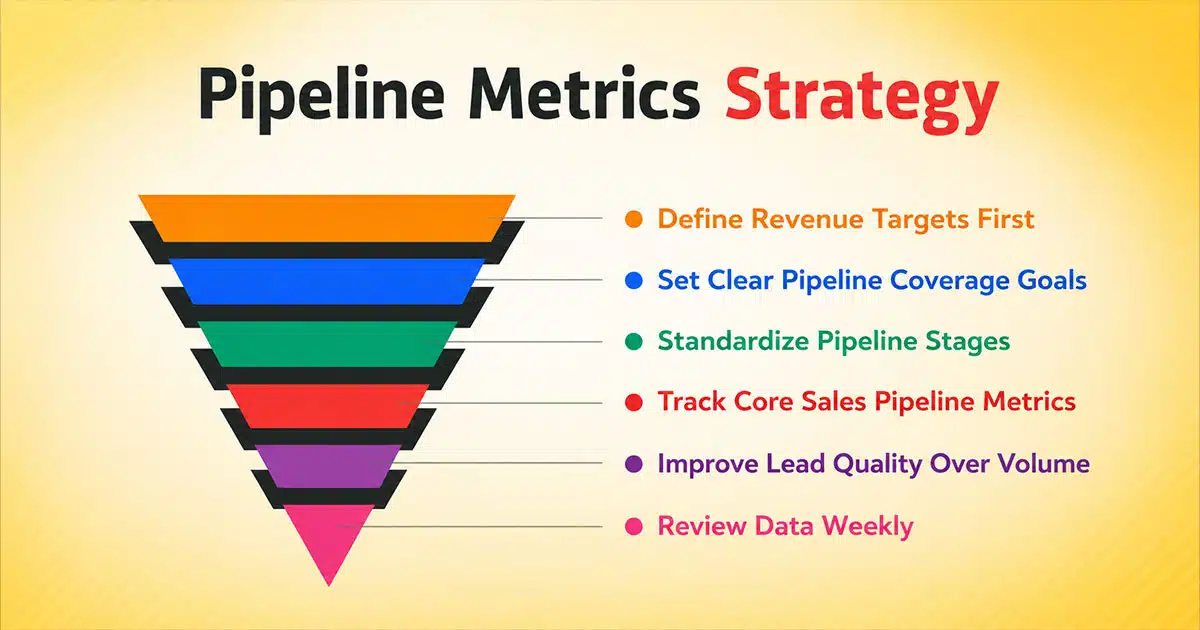
How To Build A Pipeline Metrics Strategy
A pipeline metrics strategy connects daily sales activity management with revenue targets. Without structure, pipeline data becomes noise. Research shows that companies with a defined sales process are 33% more likely to hit sales goals. Clear strategy improves forecast accuracy and pipeline health.
Define Revenue Targets First
Revenue targets guide every pipeline decision. Sales managers must calculate how much revenue the team needs to close. If the annual sales target is $2 million and average deal size is $40,000, the team needs 50 closed won deals.
Clear targets help determine required number of opportunities. They also influence pipeline coverage ratio and win rate goals. Sales organization leaders who align pipeline metrics with revenue targets improve sales forecasting accuracy.
Set Clear Pipeline Coverage Goals
Pipeline coverage ratio protects future revenue. Most SaaS and B2B teams aim for 3x to 5x coverage. If quarterly revenue targets equal $500,000, total pipeline value should exceed $1.5 million.
Balanced coverage improves forecasted revenue. Low coverage increases risk. Excess pipeline with poor lead quality reduces pipeline quality. Regular pipeline reviews ensure open pipeline supports sales goals.
Standardize Pipeline Stages
Clear pipeline stages create visibility. Sales funnel stages such as initial contact, proposal stage, and closed deal must follow strict definitions. Without structure, stage conversion rates become unreliable.
Research shows that consistent sales process improves win rate by up to 18%. Sales reps must move qualified leads through defined stages. Standard stages improve pipeline health and deal velocity.
Track Core Sales Pipeline Metrics
A strong strategy tracks pipeline coverage ratio, win rate, sales velocity, average deal size, and average sales cycle length. These are the most important sales pipeline metrics.
Sales velocity connects deal size, number of opportunities, and sales cycle. Faster pipeline velocity increases total sales. Metric tracks must align with revenue targets and sales strategy.
Improve Lead Quality Over Volume
More leads do not guarantee more deals. Poor lead quality reduces conversion rates and wastes resources. Studies show that nearly 50% of marketing leads are not sales qualified leads.
Sales teams must focus on right prospects and qualified opportunities. Strong qualification improves pipeline quality and win rate. Fewer but better leads create more predictable revenue.
Review Data Weekly
Weekly pipeline reviews strengthen accountability. High performing SaaS companies review pipeline metrics every week, not just at quarter end. Regular review improves forecast accuracy.
Sales managers must identify deals that stall beyond average sales cycle length. Early action prevents lost deals and protects forecasted revenue. Consistent review supports data driven decisions.
Align Sales And Forecasting Discipline
Sales forecasting must reflect real pipeline data. Overly optimistic forecasts damage credibility. Research shows that fewer than 50% of sales organizations achieve high forecast accuracy.
Pipeline metrics must guide forecasting conversations. Closed deals, win rate trends, and deal velocity should shape predictions. Structured discipline turns pipeline value into reliable revenue expansion.
Pipeline Benchmarks For SaaS And B2B Teams
Pipeline benchmarks help you understand whether your sales pipeline performs at an average, below average, or high level. Without benchmarks, pipeline metrics have no context. SaaS companies and B2B teams rely on clear numbers to improve forecast accuracy, pipeline health, and revenue targets.
Win Rate Benchmarks
Win rate is one of the most important sales pipeline metrics. In B2B environments, the typical win rate ranges from 15% to 30%. Enterprise sales teams often fall closer to 15% due to complex sales cycles and multiple decision makers.
Higher win rate improves sales performance without adding more leads. If your sales team closes only 10% of qualified opportunities, pipeline coverage must increase. Strong qualification improves conversion rates and protects pipeline quality.
Pipeline Coverage Ratio Standards
Most SaaS and B2B sales organizations aim for 3x to 5x pipeline coverage ratio. If your sales target is $1 million, total pipeline value should range between $3 million and $5 million.
Low pipeline coverage creates pressure late in the quarter. High coverage with weak lead quality creates false confidence. Balanced pipeline coverage supports reliable sales forecasting and stable forecasted revenue.
Average Sales Cycle Length
Average sales cycle length varies by deal size and industry. SaaS companies often see cycles between 30 and 90 days. Enterprise B2B sales can extend beyond 120 days.
Longer sales cycle reduces sales velocity and delays revenue. Sales managers must track number of days from initial contact to closed deal. Accurate cycle data improves revenue planning and strengthens pipeline reviews.
Average Deal Size Benchmarks
Average deal size differs across segments. SMB SaaS companies may close deals between $5,000 and $20,000 annually. Enterprise accounts often exceed $50,000 or more in annual contract value.
Larger average deal reduces number of opportunities required to hit revenue targets. Smaller average deal demands more closed won deals. Sales strategy must align deal size with sales goals and customer lifetime value.
Stage Conversion Rates
Stage conversion rates reveal how deals move through pipeline stages. Research shows that many B2B teams lose over 40% of opportunities between proposal stage and closed deal.
Weak stage performance signals issues in the sales process. Strong conversion rates increase deal velocity and pipeline health. Sales reps who focus on qualified leads improve win rate and reduce lost deals. Clear benchmarks create accountability across the entire sales organization.
Common Mistakes Sales Teams Make With Pipeline Metrics
Many sales teams track pipeline metrics, but few use them correctly. Poor metric discipline leads to weak forecast accuracy and missed revenue targets. Research shows that nearly 60% of forecasted deals do not close in the expected period. Most of those failures come from preventable pipeline mistakes.
Overestimating Pipeline Value
Pipeline value looks impressive on dashboards. However, inflated numbers create false confidence. Many sales reps add unqualified opportunities just to show more deals in the open pipeline.
Research suggests that up to 30% of pipeline opportunities in B2B CRM systems for sales are inactive or low quality. Poor lead quality reduces win rate and damages sales forecasting. Sales managers must review qualified opportunities, not just total pipeline value.
Ignoring Pipeline Coverage Ratio
Pipeline coverage ratio protects revenue targets. Many teams chase more leads without checking whether coverage supports the sales target. A 3x to 5x pipeline coverage ratio is common in SaaS and B2B sales.
Low coverage signals future revenue gaps. High coverage with weak qualification creates pipeline noise. Sales organization leaders must align coverage with average deal size, win rate, and sales cycle length.
Focusing Only On New Opportunities
New opportunities feel exciting. However, pipeline health depends on movement across pipeline stages. Sales teams often ignore stalled deals while chasing fresh prospects.
Data shows that 40% or more deals stall in the proposal stage in many B2B environments. Strong pipeline reviews identify deals that sit too long. Balanced attention improves deal velocity and conversion rates.
Neglecting Sales Cycle Length
Sales cycle length directly impacts forecasted revenue. Many teams assume deals will close faster than historical averages. Optimistic assumptions hurt forecast accuracy.
If average sales cycle length is 90 days, a deal opened last month rarely becomes a closed deal this quarter. Realistic cycle data supports accurate forecasts and smarter sales strategy.
Poor Stage Conversion Tracking
Stage conversion rates reveal where deals drop. Yet many sales organizations track only total closed won deals. That approach hides funnel weaknesses.
If win rate is 20% but conversion from demo to proposal is only 40%, the sales process needs attention. Clear stage metrics improve pipeline quality and support data-driven decisions.
Relying On Gut Feeling Over Data
Some sales managers trust instinct over numbers. However, teams that use data-driven decisions outperform peers. Studies show that data-focused sales organizations achieve up to 5% higher productivity and stronger sales performance.
Pipeline metrics exist to guide decisions. Win rate, sales velocity, and pipeline coverage ratio provide objective insight. Gut feeling cannot replace structured sales pipeline metrics.
Skipping Regular Pipeline Reviews
Pipeline reviews maintain discipline. Without consistent reviews, open pipeline becomes outdated. Lost deals stay active. Forecasted revenue becomes unreliable.
High-performing SaaS companies review pipeline weekly. They identify deals at risk and remove weak opportunities early. Consistent review strengthens pipeline health and improves overall sales outcomes.
How Gain.io Supports Smarter Pipeline Metrics And Predictable Revenue
Gain.io helps sales teams turn raw pipeline data into clear revenue insights. The platform gives full visibility into pipeline value, qualified opportunities, and forecasted revenue in one place. Gain.io has several key features to simplify you customer relationship management. Sales managers can track pipeline coverage ratio, win rate, average deal size, and sales cycle length without manual reports. Clear dashboards improve pipeline health and forecast accuracy.
Sales reps see how many deals sit in each pipeline stage and which sales opportunities require attention. Real-time updates support better pipeline reviews and smarter sales forecasting. Instead of guessing how much revenue will close, teams rely on structured sales pipeline metrics. Better visibility improves conversion rates, deal velocity, and overall sales performance. Predictable revenue becomes achievable, not accidental. You can enjoy Gain.io at a suitable price.
FAQs
How Do You Calculate The Required Pipeline Based On Sales Target?
Yes, calculate required pipeline using sales target and typical win rate. Divide revenue target by win rate, then adjust for average deal value. This ensures enough qualified prospects to support revenue targets.
Can Small Sales Teams Benefit From Advanced Pipeline Metrics?
Yes, small sales teams benefit from structured sales pipeline metrics. Clear metric tracks improve sales productivity, pipeline visibility, and forecast reliability even with limited resources.
What Is A Healthy Number Of Opportunities In A Sales Pipeline?
A healthy number of opportunities depends on conversion ratios and average deal value. If win rate is 20%, you may need five qualified opportunities for every closed deal to maintain pipeline strength.
Does Customer Lifetime Value Affect Pipeline Planning?
Yes, customer lifetime value shapes long-term sales strategy. Higher lifetime value allows focus on fewer enterprise accounts instead of chasing volume, improving pipeline quality and total value.
How Do You Identify Weak Deals Early In The Sales Funnel?
Look for stalled movement across pipeline phases and low engagement. Deals that exceed normal sales cycle benchmarks often signal risk and require immediate review.
Is Pipeline Reporting Different From Sales Forecasting?
Yes, pipeline reporting tracks real-time sales opportunities. Sales forecasting estimates expected revenue based on win probability, deal stage, and conversion ratios.
Can Automation Improve Pipeline Performance?
Yes, automation improves data accuracy and opportunity management. Automated alerts highlight declining conversion ratios and protect forecast accuracy across the sales organization.