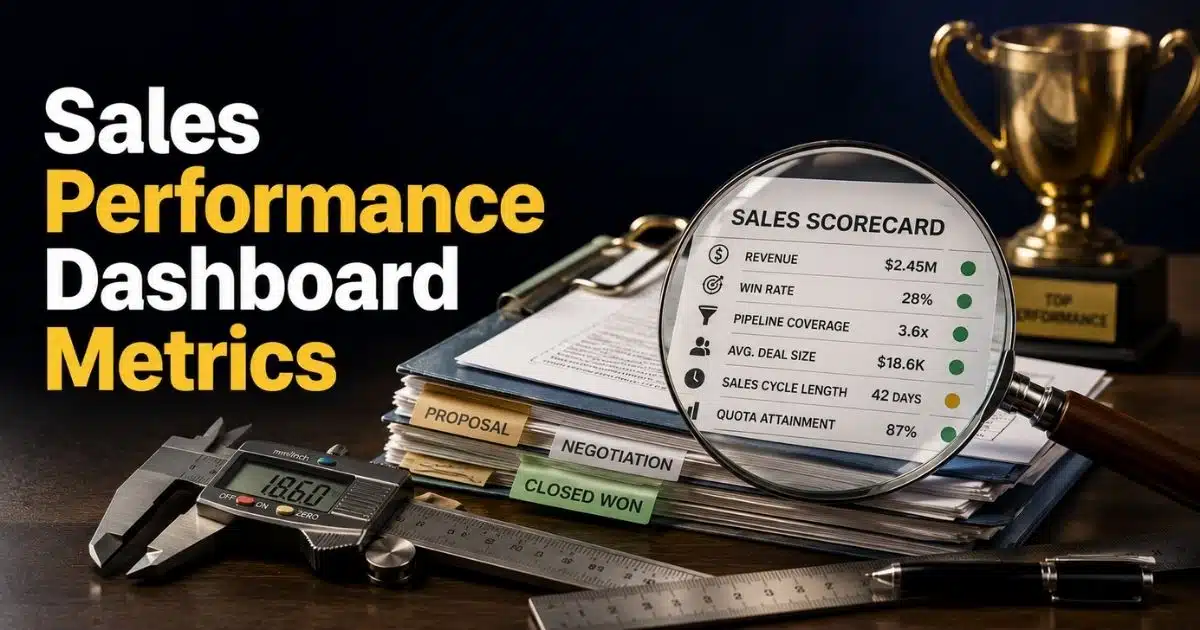
Sales teams generate more data than ever. Revenue numbers, pipeline reports, conversion rates, quotas, and activity logs pile up every day. Yet many leaders still struggle to answer a simple question: Are we actually on track to hit our goals? That is where sales performance dashboard metrics become valuable. A well-built dashboard turns scattered data into clear insights and helps teams focus on what matters most. Sales dashboards are designed to provide real-time visibility into performance, pipeline health, and revenue trends so managers can act faster and make better decisions.
The challenge is not finding more data. The challenge is tracking the right metrics. Revenue, win rate, quota attainment, pipeline coverage, sales cycle length, customer acquisition cost, and customer lifetime value each tell a different part of the story. Together, they reveal what is working, where deals are slowing down, and what actions can improve results.
In this guide, you will learn the 15 sales performance dashboard metrics every sales team should track and how each one contributes to predictable growth and stronger sales performance.
What Makes A Sales Performance Dashboard Effective?
A sales performance dashboard should do more than display numbers. It should help sales leaders understand what is happening, why it is happening, and what actions to take next. The best dashboards connect performance data with business goals and make decision-making easier.
Modern sales teams rely on dashboards for real-time visibility into revenue, pipeline health, sales activity, and forecasting. A well-designed dashboard helps teams spot risks early, improve accountability, and increase sales visibility across deals and activities.
Real-Time Visibility
Sales moves fast. A dashboard that updates once a week is already behind. Real-time visibility helps managers see performance as it happens. Teams can react to problems before they affect revenue.
Live dashboards also improve accountability. Managers can track progress against goals, monitor pipeline movement, and identify stalled deals without waiting for reports. Recent industry research shows that real-time dashboards help sales teams make faster and more confident decisions.
Real-time data also creates alignment. Everyone works from the same information. That reduces confusion and keeps teams focused on the right priorities.
Clear KPI Selection
A dashboard becomes less useful when it tracks everything. Too many metrics create noise. Sales teams need a small group of KPIs that connect directly to performance goals.
Revenue, win rate, pipeline coverage, quota attainment, and lead conversion rate often provide the clearest picture of sales health. Each metric answers a specific question about growth, efficiency, or forecasting.
A focused dashboard also improves adoption. Sales reps and managers can quickly understand what matters and where attention is needed.
Actionable Insights
Numbers alone do not improve performance. Effective dashboards turn data into actions. A good dashboard highlights trends, risks, and opportunities that require attention.
For example, a declining win rate may signal lead quality issues. A shrinking pipeline may indicate future revenue risks. A longer sales cycle could point to process bottlenecks. Dashboards help teams identify these problems before they become larger challenges.
Actionable insights help managers coach reps more effectively. They also help teams prioritize work that creates measurable results.
Connected Data Sources
Sales data often lives in different systems. CRM platforms, marketing tools, forecasting software, and customer databases all contain valuable information. A strong sales pipeline CRM dashboard brings everything together.
Centralized data reduces manual reporting and improves accuracy. Teams spend less time gathering information and more time analyzing results. Consolidated reporting also creates a complete view of the customer journey.
Better data quality leads to better decisions. When every team uses the same source of truth, performance discussions become more productive.
Predictive Performance Tracking
Top-performing sales teams do not rely only on past results. They monitor future indicators as well. A strong dashboard combines lagging indicators like revenue and win rates with leading indicators such as pipeline value and lead generation rate, especially when tracking sales performance metrics for SaaS teams.
This balance helps leaders predict outcomes before the quarter ends. Research shows that forecast accuracy remains a major challenge for many sales organizations. Predictive dashboards help close that gap by surfacing risks and opportunities earlier.
Future-focused metrics help sales teams stay proactive. Instead of reacting to missed targets, they can make adjustments while there is still time to influence results.
The 15 Sales Performance Dashboard Metrics Every Sales Team Should Track
Sales dashboards work best when they focus on metrics that influence revenue, forecasting, efficiency, and profitability. Each KPI below answers a different business question and helps sales teams understand where they stand and what actions to take next.
1. Revenue
Revenue is the most important metric on any sales performance dashboard. It shows how much money the business generates from closed deals and acts as a primary indicator of overall sales health.
Sales leaders often use revenue to measure progress toward company goals. When revenue trends move in the right direction, teams know their sales process is working effectively.
2. Win Rate
Win rate measures the percentage of opportunities that turn into closed deals. It helps teams understand sales rep effectiveness and the quality of incoming leads.
A low win rate can point to poor qualification, weak messaging, or strong competition. A high win rate often signals a healthy sales process and better conversion performance.
3. Quota Attainment
Quota attainment shows how much of a sales target has been achieved by a rep or team. It is one of the clearest ways to measure productivity.
Historical performance benchmarks help managers set realistic quotas and stretch goals. Consistent quota attainment often reflects a well-balanced pipeline and strong sales execution.
4. Pipeline Coverage
Pipeline coverage measures whether enough opportunities exist to reach future revenue targets. It compares pipeline value against quota or revenue goals.
Many sales leaders use this metric as an early warning signal. Strong pipeline coverage reduces forecasting risk and helps teams identify revenue gaps before they become problems.
5. Pipeline Value
Pipeline value represents the total potential revenue from active opportunities. It serves as one of the most important leading indicators in sales forecasting.
A healthy pipeline value gives teams confidence about future performance. Regular reviews also help managers spot weak stages and improve visual sales pipeline management and clarity.
6. Lead Conversion Rate
Lead conversion rate measures the percentage of leads that become paying customers. It shows how effectively sales and marketing teams move prospects through the funnel.
A strong conversion rate usually indicates better targeting and qualification. Lower rates often reveal gaps in lead quality or follow-up processes.
7. Opportunity Conversion Rate
Opportunity conversion rate focuses on prospects that have already entered the sales pipeline. It tracks how many opportunities eventually close as customers.
This metric provides deeper insight than lead conversion rate alone. It helps teams understand performance during the later stages of the sales cycle.
8. Average Deal Size
Average deal size measures the typical revenue generated from a closed sale. Sales teams calculate it by dividing total revenue by the number of closed deals.
Growth in average deal size can increase revenue without adding more customers. This metric also helps sales leaders evaluate upsell and cross-sell strategies.
9. Sales Cycle Length
Sales cycle length measures the time required to move a prospect from lead to closed customer. Average sales cycle length equals total days to close divided by the number of deals won.
Long sales cycles can indicate inefficiencies in the sales process. Managers often analyze this metric by individual reps to identify coaching opportunities and improve sales efficiency.
10. Deal Velocity
Deal velocity measures how quickly opportunities move through the sales pipeline and generate revenue. It combines deal size, win rate, pipeline volume, and sales cycle length.
A faster deal velocity often means more efficient sales execution. This metric helps teams identify bottlenecks and improve revenue generation speed.
11. Revenue Per Sales Rep
Revenue per sales rep tracks how much revenue each salesperson generates over a specific period. It is a valuable metric for measuring individual contribution.
Sales leaders use this KPI to compare performance across the team. It also helps identify top performers and uncover coaching opportunities for struggling reps.
12. Forecast Accuracy
Forecast accuracy measures how closely predicted revenue matches actual revenue. Accurate forecasts help businesses allocate resources and plan growth with confidence.
Poor forecast accuracy often points to pipeline issues or unrealistic assumptions. Strong forecasting creates better decision-making across sales and leadership teams.
13. Customer Acquisition Cost (CAC)
Customer acquisition cost measures the cost required to acquire one new customer. Businesses calculate CAC by dividing total sales and marketing expenses by the number of new customers gained.
A lower CAC usually reflects more efficient customer acquisition efforts. Tracking CAC over time helps businesses evaluate marketing performance and sales efficiency.
14. Customer Lifetime Value (CLV)
Customer lifetime value predicts the total revenue a customer generates throughout the relationship with a business. A common calculation multiplies customer lifetime by average purchase value.
A higher CLV often indicates stronger retention and profitability. Businesses also use CLV to identify high-value customer segments and guide loyalty strategies.
15. Activity-To-Opportunity Ratio
Activity-to-opportunity ratio measures how many sales activities are required to create a qualified opportunity. Activities may include calls, emails, meetings, and follow-ups.
This metric helps teams understand sales productivity. A healthy ratio shows that sales efforts are producing meaningful pipeline opportunities rather than just busy work.
Revenue Metrics That Measure Sales Success
Revenue metrics show whether sales efforts translate into business growth. They help teams measure results, evaluate rep performance, and identify gaps before they affect targets. A strong sales performance dashboard should track a mix of revenue-focused KPIs to provide a clear picture of sales success and future potential.
Revenue
Revenue sits at the center of every sales dashboard. It measures the total income generated from closed deals and serves as the primary indicator of business health.
Most sales leaders review revenue daily because it connects directly to company goals. Revenue trends also help teams evaluate whether sales strategies, pipeline activities, and forecasting efforts are producing the desired results. Research shows revenue growth remains one of the most closely monitored metrics across high-performing sales organizations.
Win Rate
Win rate measures the percentage of opportunities that become paying customers. It helps teams understand how effectively they convert qualified prospects into revenue.
A strong win rate often reflects good lead quality, effective sales conversations, and strong product-market fit. Many B2B organizations track win rate closely because even small improvements can produce significant revenue gains without increasing lead volume. Sales teams with higher win rates often achieve more predictable growth and forecasting accuracy.
Quota Attainment
Quota attainment shows how much of a sales target an individual rep or team achieves during a given period. It provides a direct measure of sales productivity.
Historical performance data plays an important role here. Sales managers use past attainment levels to set realistic quotas and stretch goals. Consistent quota attainment usually indicates healthy pipelines, effective coaching, and strong execution. It also helps leadership identify top performers and areas that need support.
Revenue Per Sales Rep
Revenue per sales rep measures the average revenue generated by each salesperson. This metric helps businesses evaluate individual contribution and team efficiency.
A growing sales team does not always guarantee higher productivity. Revenue per rep helps leaders determine whether additional hiring improves results. It also highlights performance gaps between team members. Strong organizations use this metric to support coaching decisions, territory planning, and compensation strategies.
Average Deal Size
Average deal size measures the typical revenue generated from a closed sale. Teams calculate it by dividing total revenue by the number of closed deals.
This metric reveals whether growth comes from more customers or larger contracts. An increase in average deal size often signals successful upselling, cross-selling, or enterprise sales efforts. Sales leaders frequently monitor this KPI alongside win rate and revenue because it has a direct impact on overall sales performance and profitability.
Pipeline Metrics That Predict Future Revenue
Revenue tells you what already happened. Pipeline metrics show what may happen next. They help sales leaders evaluate future opportunities, identify risks early, and make smarter forecasting decisions. A strong sales performance dashboard should track pipeline health closely because future revenue often depends on what is happening inside the pipeline today.
Pipeline Coverage
Pipeline coverage shows whether your team has enough active opportunities to achieve future revenue goals. Most sales leaders compare total pipeline value against quota targets to assess readiness.
A healthy pipeline coverage ratio reduces uncertainty and improves forecast confidence. Low coverage often signals future revenue gaps. Early visibility gives teams time to generate more opportunities before targets are at risk.
Pipeline Value
Pipeline value measures the total potential revenue from open opportunities. It serves as one of the most important leading indicators on a sales dashboard.
This metric helps teams estimate future revenue before deals close. Growth in pipeline value usually indicates stronger sales momentum. Regular pipeline reviews also help managers focus resources on the opportunities with the highest potential impact.
Lead Generation Rate
Lead generation rate tracks how many new leads enter the sales funnel during a specific period. It helps sales teams understand whether pipeline growth remains sustainable.
A strong lead generation rate supports long-term revenue goals. Fewer incoming leads can create future pipeline shortages. Sales and marketing teams often monitor this metric together because it directly affects future sales opportunities and forecasting accuracy, especially when they use CRM systems to manage and nurture leads.
Opportunity Conversion Rate
Opportunity conversion rate measures how many qualified opportunities become customers. It provides insight into pipeline quality and sales execution.
A large pipeline does not guarantee results. High conversion rates show that opportunities are moving successfully through the sales process. Lower rates may indicate qualification issues, competitive challenges, or gaps in the sales approach that require attention.
Forecast Accuracy
Forecast accuracy compares projected revenue with actual revenue. It helps businesses evaluate the reliability of their sales forecasts and pipeline assumptions.
Strong forecast accuracy often reflects healthy pipeline management and better sales visibility. Poor accuracy can lead to resource planning problems and missed expectations. Teams that monitor forecast accuracy regularly can improve decision-making and create more predictable revenue outcomes.
Productivity Metrics That Reveal Rep Performance
Productivity metrics help sales leaders understand how effectively teams turn effort into results. They reveal where time goes, which activities create opportunities, and how individual reps contribute to business goals. A strong sales performance dashboard should track productivity alongside revenue to provide a complete view of performance.
Revenue Per Sales Rep
Revenue per sales rep measures how much revenue each salesperson generates during a specific period. It helps sales managers evaluate individual contribution and compare performance across the team and align these results with sales activity metrics for a performance-focused engine.
This metric often reveals coaching opportunities and resource gaps. A sales representative with strong activity levels but low revenue may need support with closing deals. Many sales organizations use revenue per rep to improve sales productivity and allocate resources more effectively.
Activity-To-Opportunity Ratio
Activity-to-opportunity ratio measures how many sales activities are required to create a qualified opportunity. Activities may include calls, emails, demos, and meetings.
A healthy ratio shows that sales activities are producing meaningful results. A poor ratio may indicate wasted effort or poor prospect targeting. Sales leaders often use this metric in a sales activity dashboard to track performance and improve sales efficiency.
Sales Velocity
Sales velocity measures how quickly opportunities move through the sales funnel and generate revenue. It combines win rate, average deal size, sales cycle length, and opportunity volume into a single metric and ties closely to sales pipeline health metrics for revenue planning.
A higher sales velocity means revenue reaches the business faster. Sales teams that improve sales velocity often increase sales without adding more leads. This KPI also helps identify bottlenecks across pipeline stages and sales operations.
Sales Activity Volume
Sales activity volume tracks the number of daily or weekly activities completed by each rep. Common activities include calls, emails, follow-ups, demos, and meetings.
Activity alone does not guarantee success. However, it provides useful context when comparing sales performance across the team. Sales managers often review activity data alongside conversion metrics to develop sales strategies and identify productivity trends.
Sales Leaderboard Position
A sales leaderboard ranks sales reps based on selected performance metrics. Common ranking factors include revenue, quota attainment, closed deals, and sales opportunities created.
Leaderboards create visibility and healthy competition within a sales organization. They also help managers identify top performers and recognize achievement. When used correctly, a sales competition dashboard can motivate teams while keeping everyone focused on shared sales goals.
Leading Vs Lagging Metrics: Which KPIs Matter Most?
Not all sales KPIs serve the same purpose. Some metrics help predict future results, while others measure outcomes that already happened. A high-performing sales performance dashboard should include both. Together, they provide actionable insights, improve forecast accuracy, and support data-driven decisions across the sales organization.
Metric Type | Purpose | Examples | Best Use Case |
|---|---|---|---|
Leading Indicators | Predict future sales performance and forecasted revenue before deals close | Pipeline Coverage, Pipeline Value, Lead Conversion Rate, Sales Activities, Sales Velocity, Monthly Recurring Revenue Growth | Early risk detection, sales planning, pipeline management, sales strategy development |
Lagging Indicators | Measure past performance and confirm business outcomes | Total Revenue, Win Rate, Quota Attainment, Average Deal Size, Customer Acquisition Cost (CAC), Customer Lifetime Value (CLV) | Performance evaluation, sales reporting, business performance reviews |
Leading Indicators | Help sales leaders identify growth opportunities before revenue is affected | Sales Opportunities, Pipeline Stages, Sales Funnel Health, Marketing Efforts, Customer Acquisition Trends | Forecasting, resource allocation, sales operations planning |
Lagging Indicators | Show whether sales goals were achieved after a period ends | Revenue Per Sales Rep, Average Revenue, Recurring Revenue, Total Revenue Generated | Team performance analysis, sales leaderboard reviews, territory comparisons |
Leading Indicators | Support predictive analytics and proactive decision-making | CRM Data, Sales Activity Dashboard Metrics, Opportunity Creation Rate | Future planning and sales pipeline dashboard management |
Lagging Indicators | Validate the success of sales and marketing efforts | Revenue Growth, Customer Retention Results, Closed-Won Revenue | Executive reporting and long-term business reviews |
How To Build A Sales Performance Dashboard For Different Sales Roles
Different teams need different views of the same sales data. A sales representative focuses on daily activities, while sales leaders care about forecasted revenue and business performance. Customizable sales dashboards help every role track performance, make data driven decisions, and focus on the metrics that matter most.
Sales Representative Dashboard
A sales representative needs a dashboard that supports daily execution. Revenue, lead conversion rate, sales activities, and open sales opportunities should remain front and center.
A simple sales activity dashboard helps reps prioritize tasks and stay focused. Real-time data also makes it easier to identify follow-ups, track performance, and spot growth opportunities. The goal is not more data. The goal is faster action and better results.
Sales Manager Dashboard
A sales manager dashboard should focus on team performance and accountability. Key metrics often include quota attainment, win rate, forecast accuracy, and average sales cycle length.
Sales managers also need visibility into sales territories and individual rep performance. A dashboard with sales reporting tools and strong sales deal tracking practices makes comparing sales results easier. This helps managers identify coaching opportunities and develop sales strategies based on actual performance trends.
Sales Operations Dashboard
Sales operations teams focus on efficiency and process improvement. Their dashboard should consolidate data from multiple data sources, including B2B sales CRM systems, marketing platforms, and sales tools.
A strong sales operations dashboard highlights pipeline stages, sales trends, and performance metrics. AI sales assistant tools for pipeline efficiency can layer on predictive analytics to help identify bottlenecks before they impact revenue. Better visibility leads to more accurate planning and smoother execution across the sales organization.
Executive Leadership Dashboard
Executives need a high-level view of business performance. Revenue growth, total revenue generated, recurring revenue, monthly recurring revenue, and customer lifetime value often receive the most attention, even in sectors like retail where CRM tools help teams stay organized.
Sales leaders use these dashboards to evaluate sustainable business growth and forecast future performance. A clear dashboard helps leadership connect sales strategy with business goals. It also provides actionable insights for long-term planning and resource allocation.
Pipeline Management Dashboard
A sales pipeline dashboard focuses on future revenue. Pipeline coverage, pipeline value, sales velocity, and forecasted revenue help teams understand what may happen next, especially when supported by dedicated sales pipeline management software.
Many organizations also use a sales opportunity dashboard, a sales pipeline built with clear stages, and a sales cycle length dashboard to monitor deal movement across the sales funnel. This approach helps teams identify stalled opportunities, improve customer experience, and increase sales before revenue targets are affected.
How To Turn Dashboard Metrics Into Sales Growth
Sales dashboard metrics create value only when they lead to action. Numbers alone do not improve results. Teams must use dashboard insights to adjust priorities, refine processes, and respond to changes quickly. A well-designed performance dashboard helps sales leaders turn raw data into smarter decisions, stronger execution, and consistent revenue growth.
Focus On Key Metrics
Many teams make the mistake of tracking too many numbers. A crowded dashboard often creates confusion instead of clarity. The best sales dashboards focus on a small set of key metrics tied directly to business goals.
Revenue, forecast accuracy, lead conversion rate, and pipeline coverage are strong examples. These key performance indicators help sales leaders identify what needs attention without getting lost in unnecessary data.
Act On Sales Trends
Sales trends reveal patterns that may not appear in daily reports. A sudden drop in conversions or a longer sales cycle can signal problems before revenue declines.
Regular reviews of sales metrics help teams respond faster. A sales performance dashboard should make trends easy to spot through visual reports and actionable insights, especially when paired with a simpler, CRM-driven sales workflow. Early action often prevents small issues from becoming larger revenue problems.
Use Data To Improve Coaching
Sales managers need more than intuition to coach effectively. Dashboard data provides a clear view of rep performance, sales activities, and opportunity progress.
A sales manager dashboard helps identify strengths and weaknesses across the team. Managers can use this information to create targeted coaching plans, improve sales productivity, and apply sales win rate strategies for B2B growth to help reps achieve sales targets more consistently.
Align Sales And Marketing
Revenue growth depends on collaboration between sales and marketing teams. Shared dashboards help both groups understand lead quality, customer behavior, and campaign performance.
Customer insights from marketing channels can reveal which prospects are most likely to become paying customers. Better alignment improves customer experience, supports marketing efforts, and guides the selection of sales pipeline software that supports a healthier sales funnel from first contact to closed deal.
Make Data-Driven Decisions
Successful sales organizations rely on facts rather than assumptions. Dashboard metrics provide the information needed to evaluate opportunities, allocate resources, and plan future growth.
A performance dashboard that combines CRM data, predictive analytics, and sales reporting supports better decisions at every level. Teams can track performance, identify growth opportunities, and increase sales with greater confidence when their CRM includes smart CRM tools for sales teams. Over time, this approach creates stronger business performance and more sustainable business growth.
How Gain.io Helps Teams Turn Sales Metrics Into Revenue Growth
Sales metrics become valuable only when teams can act on them quickly. Gain.io helps businesses move beyond basic reporting by turning sales data into clear, actionable insights. Instead of jumping between spreadsheets, CRM records, and disconnected tools, teams get a single view of revenue, pipeline health, sales activities, and forecast accuracy with an all-in-one CRM to grow your sales and team.
With real-time visibility into key performance indicators, sales leaders can identify risks earlier, improve sales productivity, and make faster decisions. Gain.io also supports role-based dashboards, so sales representatives, managers, and executives see the metrics that matter most to their goals, making it an ideal CRM for startups and small sales teams. By combining leading indicators, lagging indicators, predictive analytics, and sales reporting in one platform, Gain.io helps teams improve forecasting, optimize performance, and drive sustainable revenue growth with confidence.
FAQs
Which Sales Performance Dashboard Metrics Should Small Businesses Prioritize?
Yes. Small businesses should focus on a few high-impact sales KPIs instead of tracking dozens of metrics. Revenue, lead conversion rate, pipeline coverage, customer acquisition cost, and forecast accuracy often provide the clearest view of business performance and revenue growth.
Can Sales Dashboard Metrics Improve Forecast Accuracy?
Yes. Leading indicators such as pipeline value, sales opportunities, and sales velocity help teams predict future outcomes before deals close. A sales performance dashboard that combines leading and lagging metrics often produces more reliable forecasted revenue.
How Often Should Teams Review Sales Dashboard Data?
Review frequency depends on the metric. Sales activities, pipeline changes, and real-time data may require daily reviews, while customer lifetime value and customer acquisition cost often work better on a monthly basis.
What Is The Difference Between A Sales Pipeline Dashboard And A Sales Activity Dashboard?
A sales pipeline dashboard focuses on opportunities, pipeline stages, and forecasted revenue. A sales activity dashboard focuses on actions such as calls, emails, meetings, and follow-ups.
Should Every Sales Team Use The Same Dashboard Metrics?
No. Different roles need different insights. A sales representative may focus on sales activities and opportunities, while executives prioritize recurring revenue, total revenue generated, and customer lifetime value.