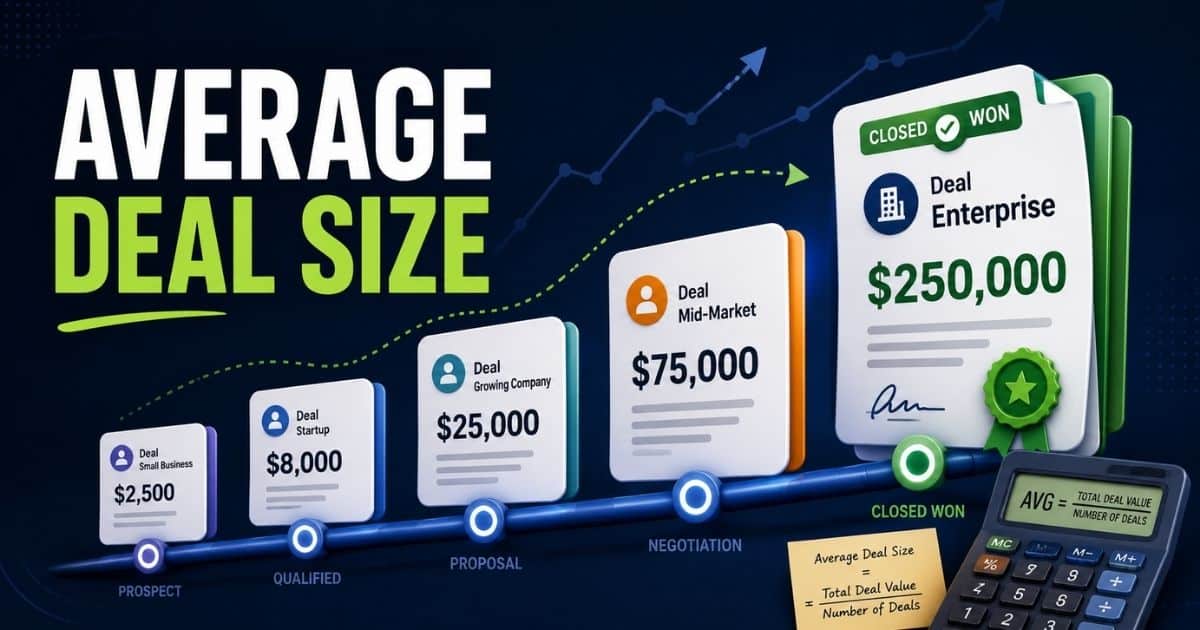
Sales velocity tells you how fast your sales team turns opportunities into revenue. It combines four numbers, number of deals, deal value, win rate, and sales cycle length, into one sales velocity equation that shows the real speed of your sales pipeline. Every sales process has its own natural rhythm, but without measuring velocity, it is hard to know where deals slow down or why revenue feels unpredictable. This guide breaks down the sales velocity formula step by step, shows you exactly how to calculate it and shares practical ways to speed up each variable. Whether you are refining your sales pipeline or coaching your sales team to hit targets faster, this metric gives you a clear, data-backed way to grow revenue predictably.
What Is Sales Velocity
Sales velocity is a metric that shows how quickly your team generates revenue from its pipeline. It looks at the number of opportunities you have, how many turn into paying customers, and how long that process takes. A higher sales velocity means revenue comes in faster and more predictably. Teams that focus on high-quality leads and strong follow-up naturally boost sales velocity over time. It also ties closely to average customer lifetime value, since faster-moving deals often signal a healthier, more efficient sales motion overall.
What Is Sales Velocity Formula
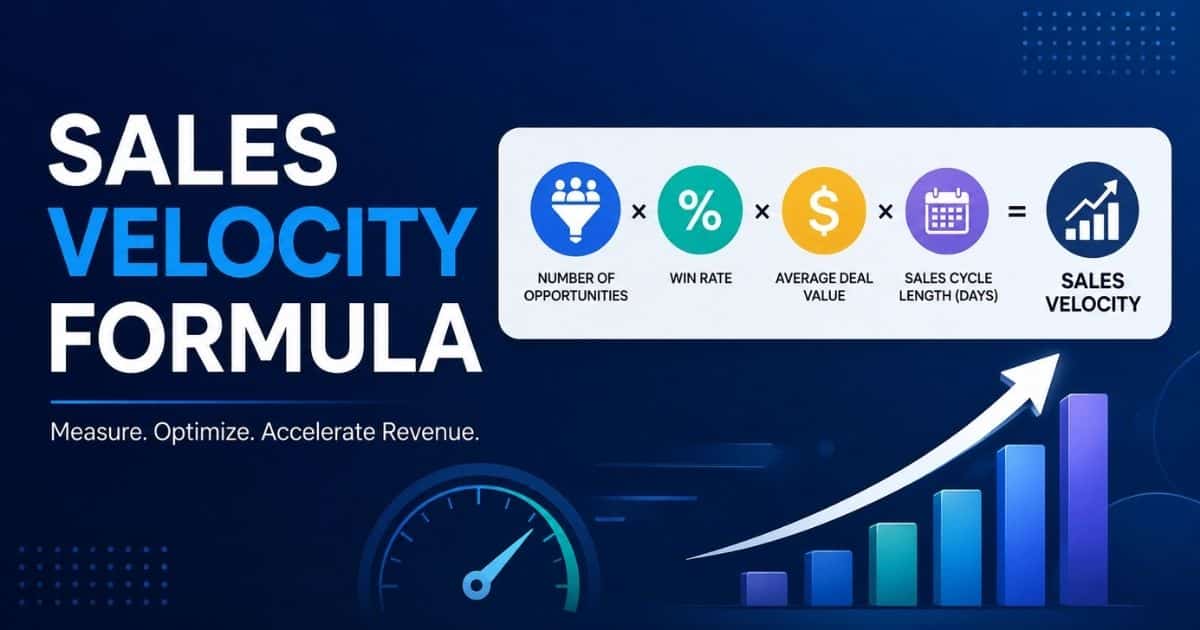
The sales velocity formula turns your pipeline activity into one clear number. It multiplies the number of opportunities by your win rate and average deal value, then divides that by your average sales cycle length. The result shows how fast qualified leads become paying customers. This formula matters because it connects every stage of your sales efforts into a single, measurable outcome.
When the number goes up, it usually means you have built a more efficient sales process somewhere along the way. Tracking this formula regularly helps teams spot friction early and keep refining toward an efficient sales process that scales.
How To Calculate Sales Velocity
The sales velocity formula combines four inputs from your sales pipeline: the number of deals, average deal value, win rate, and sales cycle length. Multiply the first three together, then divide by the sales cycle length to get your daily revenue velocity.
Sales Velocity = (Number Of Deals × Average Deal Value × Win Rate) ÷ Sales Cycle Length
Here is how it works with real numbers.
Say your sales team is tracking one quarter of pipeline activity:
- Number of deals (qualified opportunities): 40
- Average deal value: $12,000
- Win rate: 25% (0.25 as a decimal)
- Sales cycle length: 30 days
Plug these into the formula:
Sales Velocity = (40 × $12,000 × 0.25) ÷ 30
Sales Velocity = $120,000 ÷ 30
Sales Velocity = $4,000 per day
This means the sales team generates $4,000 in revenue every day from its active pipeline. Multiply that by 30 to get a monthly figure of roughly $120,000, useful for forecasting and quota planning.
Once you have this baseline number, you can see exactly which lever to pull. If deal count is strong but win rate is low, that points to a qualification problem. If deals close fast but average value is small, your team may be underselling. Running this calculation monthly or quarterly, and comparing it across reps, regions, or products, turns sales velocity from a one-time number into an ongoing diagnostic tool for the sales pipeline.
Importance Of Tracking Sales Velocity
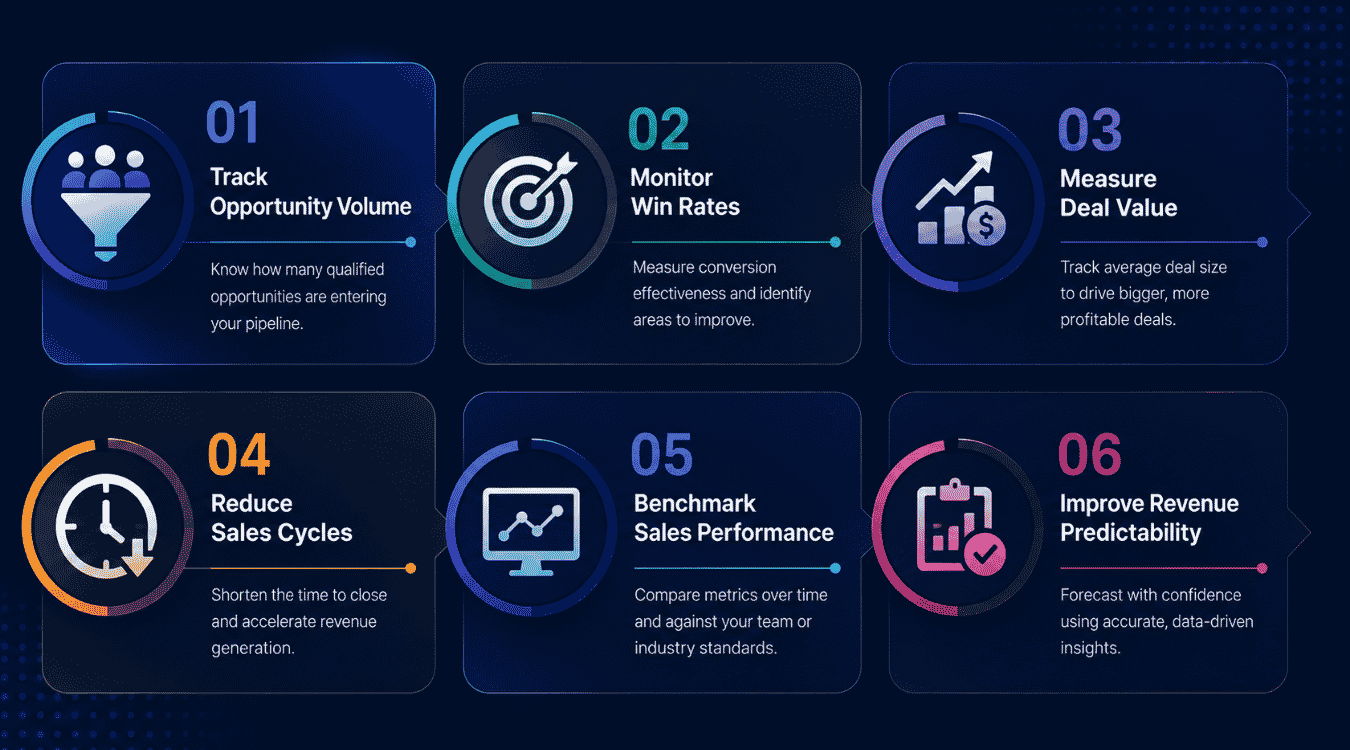
Tracking sales velocity gives your team a real time pulse on performance. It turns scattered pipeline data into one number that shows exactly where revenue is speeding up or slowing down.
Track Opportunity Volume
Opportunity volume shows how many sales opportunities are actively moving through your pipeline at any given time. A steady flow of qualified opportunities keeps your revenue engine running and prevents sudden dips when a few big deals fall through.
Tracking this number regularly helps sales leaders spot early warning signs, like a shrinking top of funnel, before they affect quota. It also helps teams plan staffing and outreach, since sales velocity measures how consistently new opportunities enter the pipeline and exposes lead generation mistakes that quietly hurt conversions.
Monitor Win Rates
Win rate shows the percentage of opportunities that actually close, and it is often the only sales velocity factor expressed as a percentage rather than a raw number. A small improvement here can lift overall velocity more than adding new leads.
Monitoring win rates by rep, segment or deal source reveals exactly where deals are lost. This insight lets managers fix messaging, pricing objections or qualification gaps quickly, turning a weak win rate into a repeatable strength across the team.
Measure Deal Value
Average deal value shows how much revenue each closed deal brings in, and it often connects directly to average customer lifetime, since bigger or longer relationships tend to carry higher value. Tracking it prevents teams from chasing volume alone.
When deal value trends downward, it usually signals discounting pressure or a shift toward smaller accounts. Watching this number helps sales leaders protect margins while still pushing for growth across every deal size in the pipeline.
Reduce Sales Cycles
The length of sales cycle directly affects how fast revenue comes in. A shorter cycle means deals convert faster, which boosts overall velocity even if other factors stay the same.
Tracking cycle length by stage shows exactly where deals stall, whether that is procurement delays, slow follow up or unclear next steps. Fixing even one bottleneck can shave days off the average cycle and meaningfully increase how quickly the team is generating revenue, especially when you apply structured long sales cycle strategies and metrics.
Benchmark Sales Performance
Sales velocity measures give teams a fair way to compare performance across reps, regions or products, since every deal type has its own natural pace. Benchmarking against past periods highlights real progress instead of relying on gut feeling.
This comparison also helps leaders set realistic targets. A team hitting strong sales velocity in one segment can share tactics with others, turning benchmarking into a practical coaching tool rather than just a scorecard.
Improve Revenue Predictability
Consistent sales velocity tracking makes future revenue far easier to forecast. Instead of guessing, leaders can project outcomes based on real pipeline speed and historical patterns.
This predictability supports smarter budgeting, hiring and planning decisions. When every deal stage is measured consistently, sales forecasting methods for accurate revenue planning turn those patterns into forecasts that reliably guide revenue rather than optimistic estimates that shift every quarter.
Types Of Sales Velocity
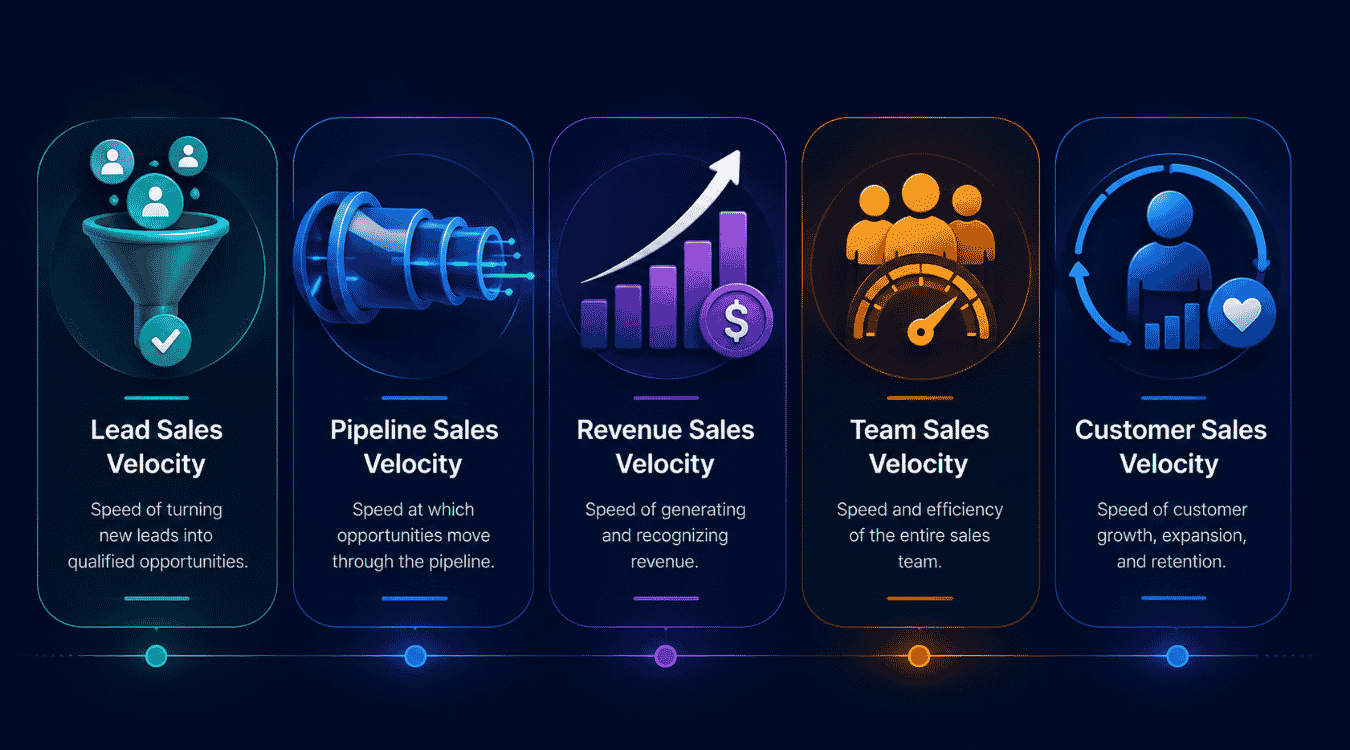
Not all sales velocity looks the same. Breaking it down by lead, pipeline, revenue, team and customer helps you see exactly where speed and friction live inside your sales funnel.
Lead Sales Velocity
Lead sales velocity tracks how fast qualified leads move from first contact into an active opportunity. It focuses on the top of the funnel, showing whether your lead generation and qualification process is keeping pace with sales team capacity.
A slow lead velocity often points to weak lead scoring or delayed follow up. Tracking this separately from deal velocity helps a sales manager see whether the bottleneck starts before deals even reach the pipeline stage.
Pipeline Sales Velocity
Pipeline sales velocity looks at how opportunities move between stages once they enter the sales funnel. It reflects the health of your overall process, not just individual deals, and highlights where prospects tend to stall.
This view helps teams spot stage specific bottlenecks, like proposals sitting too long before follow up. Improving pipeline velocity usually means tightening handoffs and shortening the average sales cycle across every stage rather than just the final close, supported by clearly defined sales pipeline stages for B2B teams.
Revenue Sales Velocity
Revenue sales velocity measures the actual dollar output of your pipeline over time, combining deal count, value and win rate into one figure. It is the version most closely tied to forecasting and financial planning.
Sales leaders use this number to set realistic sales goals for the quarter or year. Because it reflects real revenue movement, it also helps flag when strong activity is not translating into results, a critical insight for tracking sales performance metrics for SaaS teams.
Team Sales Velocity
Team sales velocity compares performance across reps, pods or regions to reveal where sales productivity is strongest. It gives a sales manager a fair, apples to apples way to measure output beyond individual quota attainment.
This breakdown highlights coaching opportunities, since one team member's approach to shortening deal velocity might work well for others. Comparing teams over time also shows whether process changes are actually improving results across the board, especially when paired with carefully chosen sales KPIs for smarter revenue decisions.
Customer Sales Velocity
Customer sales velocity looks at how quickly existing accounts move through upsell or renewal opportunities. It matters just as much as new business velocity, since expansion revenue often closes faster with fewer objections.
Tracking this separately shows whether customer success and sales are aligned. A healthy customer sales velocity usually signals strong product fit and gives teams a reliable second engine for growth alongside new customer acquisition.
Sales Velocity VS Pipeline Velocity
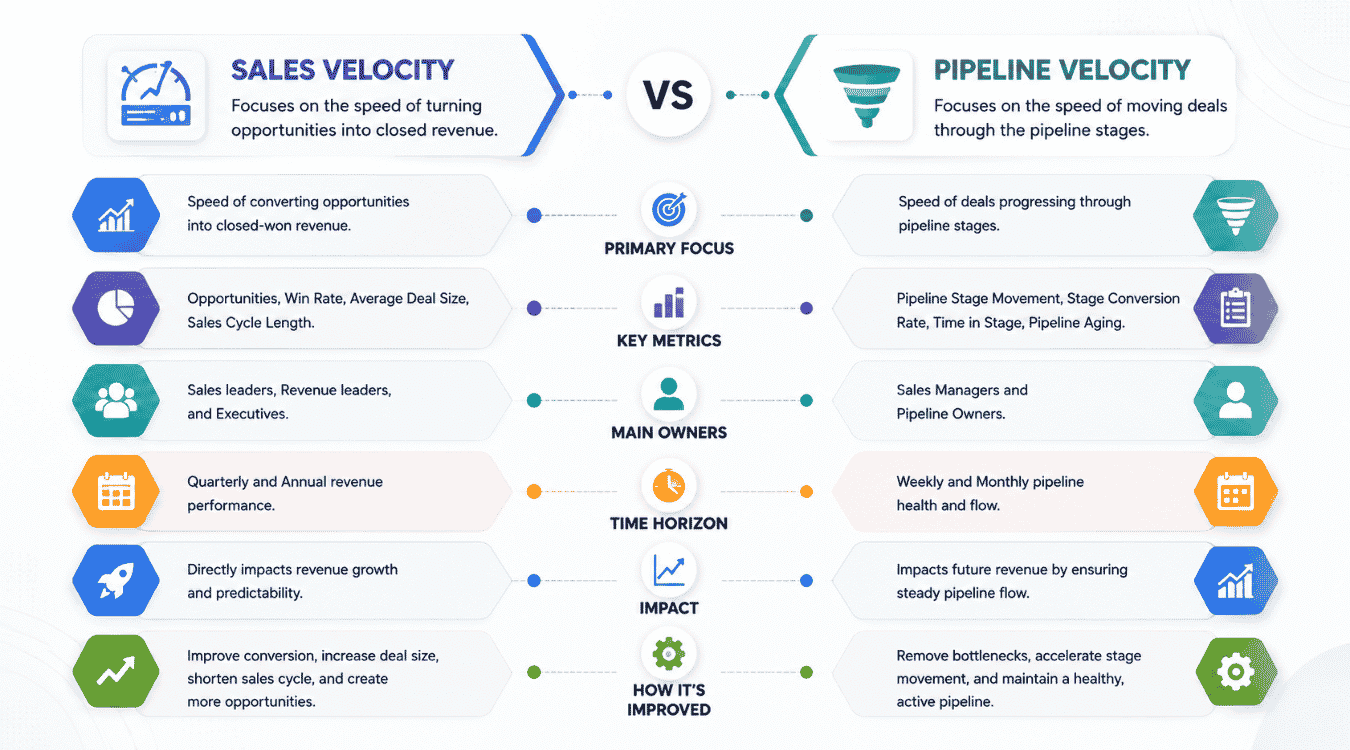
Sales velocity and pipeline velocity are often used interchangeably, but they measure slightly different things. Sales velocity is the broader metric. It combines the number of deals, average deal value, win rate and sales cycle length into one number that shows how fast your team generates revenue overall. It gives a big picture view of performance across a rep, team or the entire organization.
Pipeline velocity, on the other hand, zooms in on how opportunities move between specific stages inside the pipeline. It focuses on stage to stage movement rather than final revenue output, which makes it useful for spotting exactly where deals slow down or stall, whether that is at proposal, negotiation or final approval.
In short, sales velocity tells you how fast you are making money. Pipeline velocity tells you how fast deals are actually moving through your process. Most teams need both. Sales velocity shows the outcome, while pipeline velocity shows the mechanics behind that outcome, making it easier to diagnose problems before they hurt revenue, especially when you understand what a sales pipeline is and how to build one that works.
| Aspect | Sales Velocity | Pipeline Velocity |
|---|---|---|
| What It Measures | Overall revenue generation speed | Movement of deals between pipeline stages |
| Primary Formula Inputs | Number of deals, deal value, win rate, cycle length | Deals per stage, stage duration, conversion between stages |
| Best Used For | Forecasting and revenue planning | Diagnosing stage specific bottlenecks |
| Typical Owner | Sales leadership, RevOps | Sales managers, pipeline reviews |
| Output Type | Revenue per day, week or month | Time spent per stage, stage conversion rate |
| Scope | End to end sales process | Individual pipeline stages |
How To Measure Sales Velocity
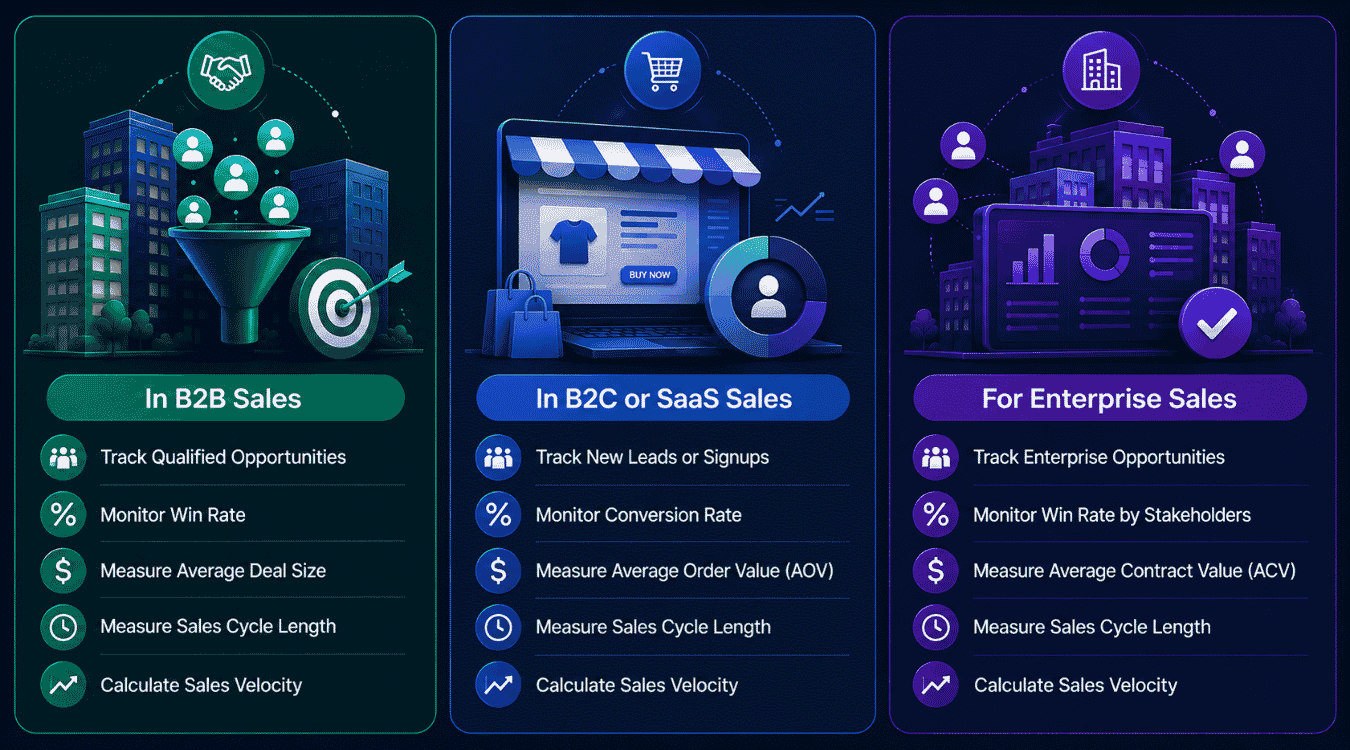
Measuring sales velocity looks different depending on your business model. B2B, B2C, SaaS and enterprise sales all move at different speeds, so the same formula needs context to actually mean something.
In B2B Sales
B2B sales velocity depends heavily on relationship building and multiple decision makers, which naturally stretches out the sales cycle. Measuring it means tracking how many qualified opportunities move through procurement, legal and budget approval before deals are won.
Because B2B deals often involve committees, win rate becomes a critical sales velocity factor. A single champion is rarely enough. Tracking deal size win rate by industry or company size helps reveal which segments close faster and which need longer nurturing before deals are won.
Good sales velocity examples in B2B often show longer cycles paired with higher deal values. This tradeoff is normal. The goal is not always speed alone, but making sure deal value x win rate stays strong enough to justify the extended timeline, supported by focused sales win rate strategies for B2B growth.
In B2C or SaaS Sales
B2C and SaaS sales velocity moves much faster, often measured in days rather than months. Shorter cycles mean small improvements in conversion rate or checkout friction can noticeably boost overall velocity within a single reporting period.
Here, deal size win rate tends to matter less than volume, since individual transaction values are smaller. Instead, teams focus on scaling the number of opportunities while keeping the sales cycle tight, since even minor delays can compound across thousands of transactions.
Trial to paid conversion is one of the clearest sales velocity examples in this space. Tracking how quickly free users convert, combined with deal value x win rate at the account level, helps SaaS teams forecast monthly recurring revenue with real confidence.
For Enterprise Sales
Enterprise sales velocity looks different again, since deal value is high but sales cycles stretch across quarters. Measuring velocity here means accepting longer timelines while closely tracking every stage to prevent unnecessary delays from creeping in.
Win rate remains an important sales velocity factor, but so does deal concentration. A handful of large accounts can swing team numbers dramatically, so tracking deal size win rate at the account level avoids misleading averages.
Because enterprise deals often close in batches, sales velocity examples here should span multiple quarters for accuracy. Looking at deal value x win rate over a rolling twelve month window gives a far more realistic picture than a single month, especially when you layer in predictive sales analytics for revenue teams.
How Sales Velocity Helps SDRs And AEs Reach Quota Fast
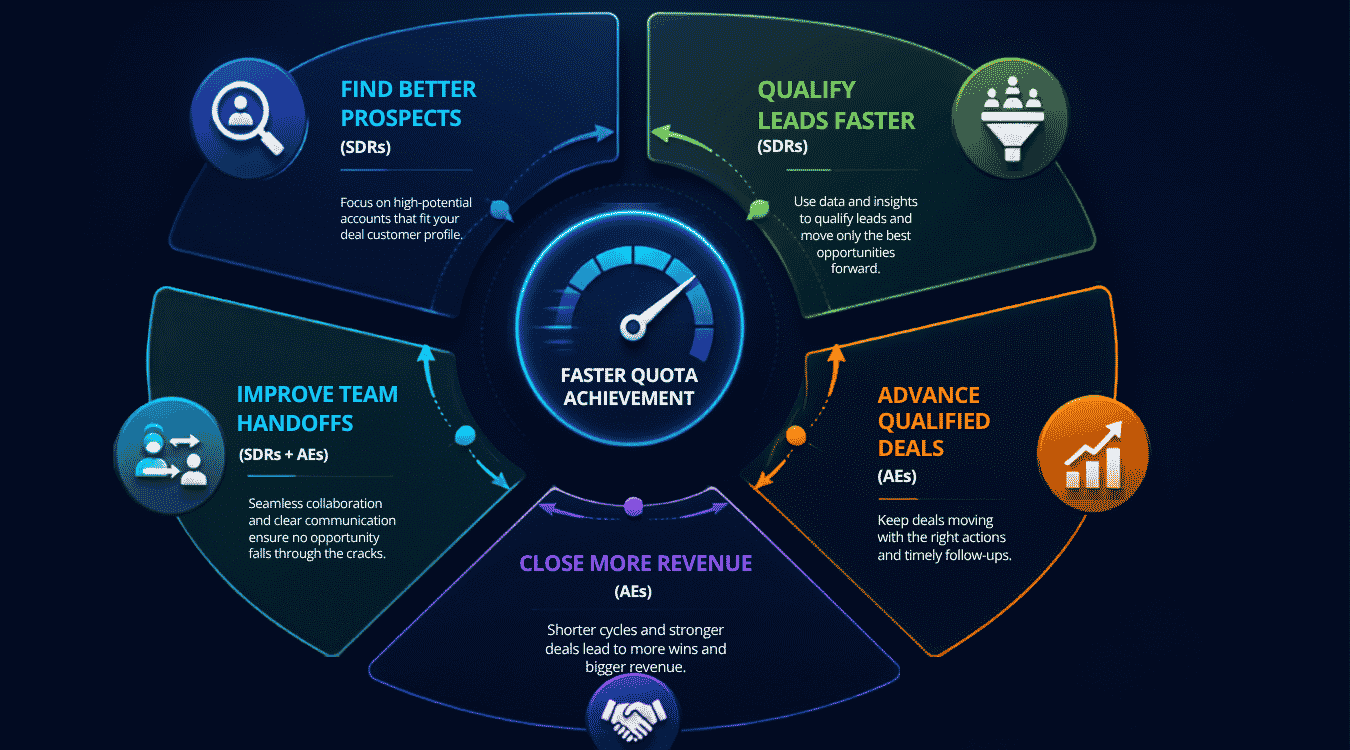
Sales velocity is not just a leadership metric. It gives SDRs and AEs a clear, practical way to see where their own effort speeds up or slows down the path to quota.
Find Better Prospects (SDRs)
Sales velocity shows SDRs which prospect profiles convert fastest, not just which ones fill the pipeline. Tracking this data reveals patterns tied to low sales velocity, like leads that stall at outreach or ignore follow up entirely.
Using these insights, SDRs can shift their sales strategy toward prospects who mirror closed won deals. This targeted approach shortens time to first meeting and feeds AEs opportunities that already fit the ideal buying process, directly supporting broader sales productivity tips for B2B sales teams.
Qualify Leads Faster (SDRs)
Faster qualification directly improves velocity, since unqualified leads quietly drag down every stage that follows. SDRs who understand sales velocity know that a quick, honest disqualification is often more valuable than passing along a shaky lead.
Clear qualification criteria, tied to budget, authority and timing, help SDRs shorten sales cycles before deals even reach an AE. This keeps pipeline data clean and gives accurate signals instead of inflated opportunity counts.
Advance Qualified Deals (AEs)
Once a deal lands with an AE, velocity data shows exactly how fast it should move through each stage. AEs use this benchmark to spot deals drifting off pace before they quietly stall near the finish line.
Understanding the buying process at each account helps AEs remove friction early, whether that means looping in the right stakeholder or clarifying next steps. This keeps deals advancing instead of sitting idle in the pipeline.
Close More Revenue (AEs)
Sales velocity connects directly to average monetary value per deal, helping AEs prioritize opportunities that move the number most. Not every deal deserves equal time, and velocity data makes that prioritization obvious.
AEs who track this closely can adjust their sales strategy in real time, focusing energy on deals most likely to close soon. This shifts quota attainment from a monthly scramble into a steady, predictable habit.
Improve Team Handoffs (SDRs + AEs)
Weak handoffs between SDRs and AEs are a common cause of low sales velocity, since context gets lost and deals lose momentum. Clear handoff standards keep information intact and keep deals moving without a restart.
When SDRs and AEs share visibility into velocity metrics, both sides understand what a strong opportunity looks like. This alignment shortens sales cycles and creates a smoother, faster path from first contact to closed revenue.
Factors That Slow Down Sales Velocity
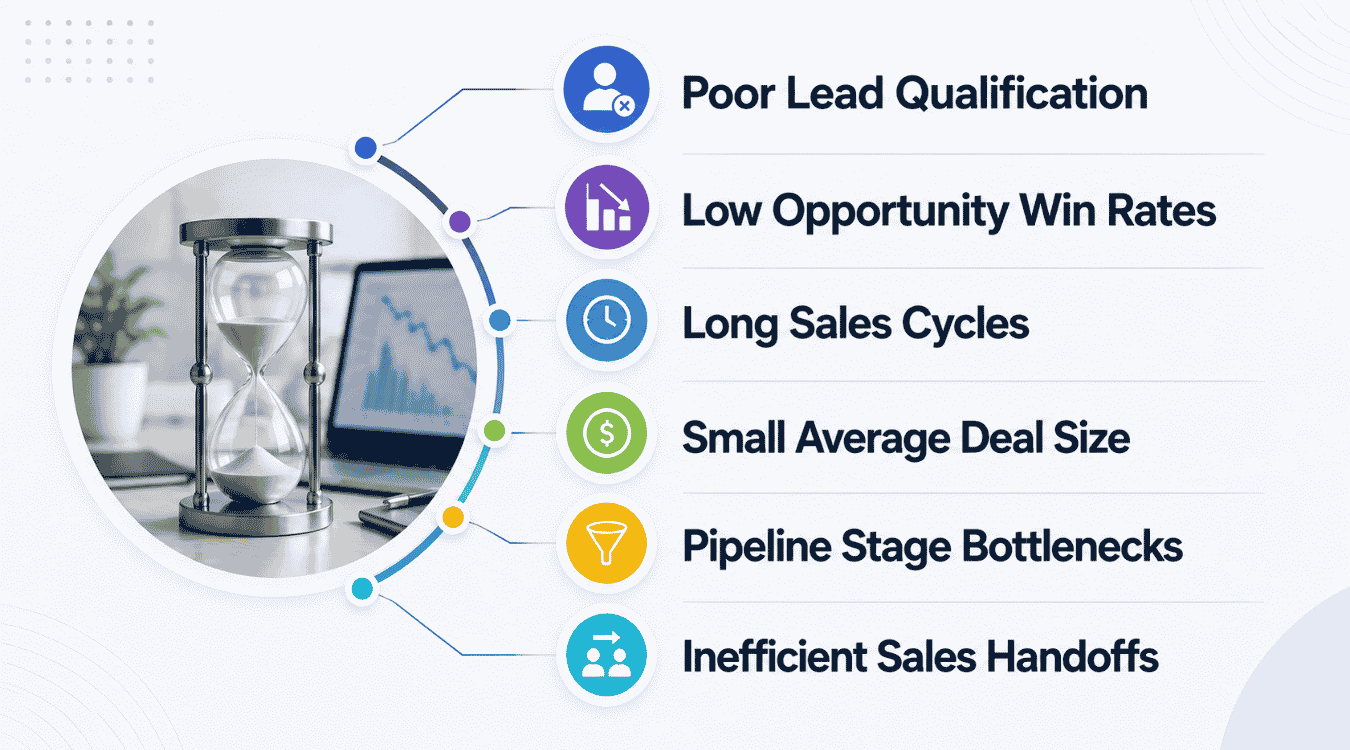
Even strong teams hit friction somewhere in the pipeline. Spotting these common slowdowns early keeps sales metrics accurate and protects revenue growth before small issues compound into bigger problems.
Poor Lead Qualification
Weak qualification lets unready prospects into the pipeline, inflating opportunity counts without adding real value. These leads sit idle, skew conversion rate data and make forecasts look stronger than actual performance justifies.
Fixing this starts with clear, consistent criteria applied before a lead becomes an opportunity. Tightening qualification standards keeps sales metrics honest and frees up rep time to focus on prospects genuinely ready to buy.
Low Opportunity Win Rates
A low win rate percentage quietly drags down overall velocity, even when deal flow and cycle length look healthy. Deals that consistently stall at the same stage usually point to messaging or objection handling gaps.
Reviewing lost deals by reason reveals patterns that are easy to miss deal by deal. Addressing these root causes directly improves conversion rate and turns a weak win rate into a steady contributor to revenue growth.
Long Sales Cycles
Extended cycles slow revenue recognition even when every other factor stays strong. Deals that linger too long often signal unclear next steps, slow internal approvals or a buyer who has quietly gone cold.
Mapping out each stage duration helps identify exactly where time gets lost. Trimming even one slow stage across many deals meaningfully speeds up velocity without requiring any change to deal size or win rate.
Small Average Deal Size
Shrinking deal size often reflects discounting pressure or a drift toward smaller, less strategic accounts. While it may keep the pipeline busy, it quietly limits how much revenue growth velocity can actually deliver.
Reviewing deal size trends by segment shows whether this shift is intentional or accidental. Refocusing on accounts that match your ideal customer profile helps restore deal value without sacrificing overall conversion rate.
Pipeline Stage Bottlenecks
Bottlenecks form when deals consistently stall at one specific stage, whether that is proposal review, legal or final sign off. These delays are often invisible until sales metrics are broken down stage by stage.
Once identified, bottlenecks usually trace back to unclear ownership or missing follow up triggers. Adding stage specific checkpoints keeps deals moving and prevents one slow step from dragging down the whole sales cycle.
Inefficient Sales Handoffs
Poor handoffs between SDRs and AEs, or between sales and customer success, cause context loss and stalled momentum. Deals that restart from scratch waste time that directly hurts velocity and frustrates buyers.
Standardizing handoff notes and expectations keeps information intact across every transition. This is one of the most common issues covered in sales velocity FAQs, since fixing it often produces fast, visible improvement across the funnel.
How To Increase Sales Velocity Metrics
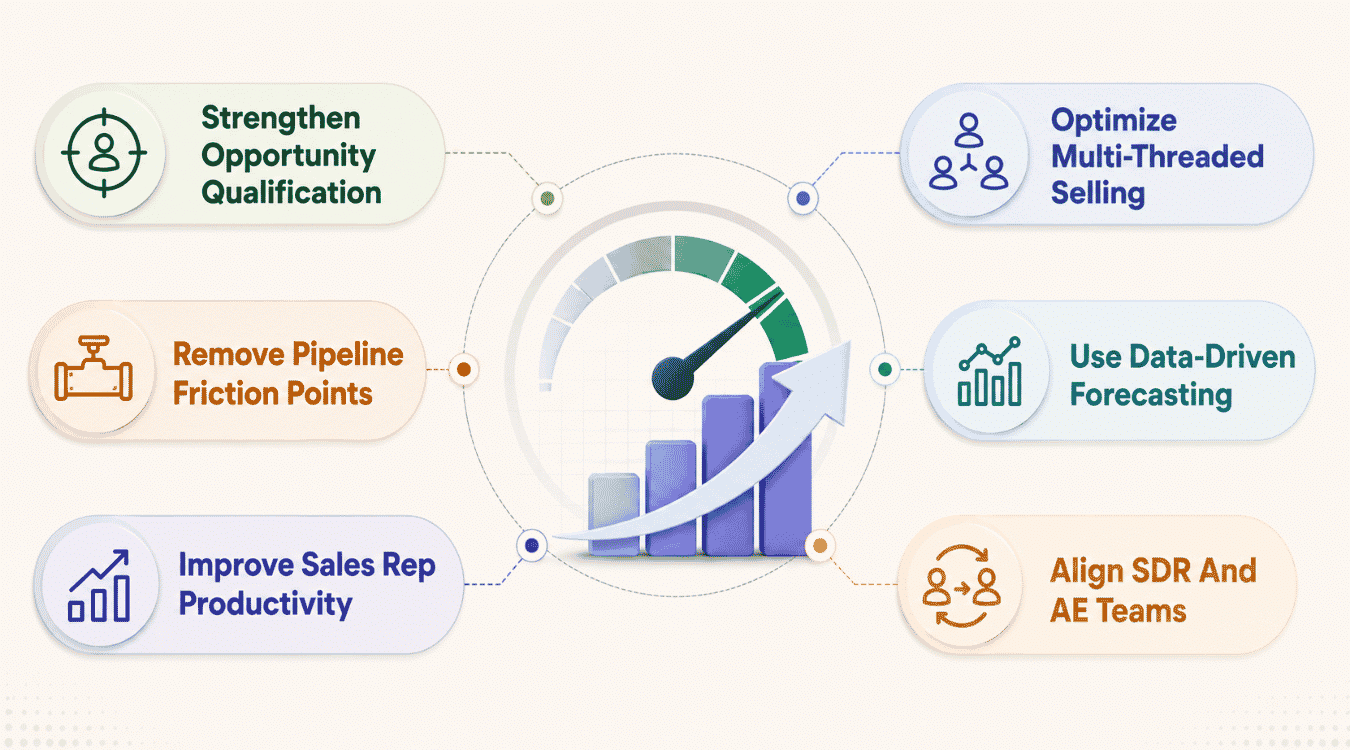
Improving sales velocity numbers rarely comes from one big fix. It usually comes from tightening several small levers across qualification, pipeline flow and team alignment at the same time.
Strengthen Opportunity Qualification
Better qualification keeps only genuine opportunities in the pipeline, which immediately improves the accuracy of every downstream metric. Fewer weak deals mean win rate and forecasts reflect reality instead of wishful thinking.
Building clear, documented criteria around budget, authority and timing helps reps qualify consistently instead of relying on gut feeling. This single change often lifts sales velocity numbers faster than any other adjustment on this list.
Remove Pipeline Friction Points
Friction shows up as unclear next steps, slow approvals or deals sitting untouched between stages. Each of these delays quietly stretches the average length of the sales cycle without anyone noticing in real time.
Mapping the pipeline stage by stage helps surface exactly where deals stall. Removing even one recurring bottleneck, like slow legal review, can meaningfully shorten cycle time and boost average revenue generated per month.
Improve Sales Rep Productivity
Productive reps move more deals forward without needing more hours in the day. This usually comes down to reducing admin work and giving reps better tools to manage follow up and prioritization, backed by disciplined sales time management tips for sales teams.
Coaching focused on time management and deal prioritization helps reps focus energy on opportunities most likely to close. Small productivity gains across a full team compound quickly, directly increasing average deal value captured per rep and reinforcing effective sales team collaboration techniques.
Optimize Multi-Threaded Selling
Relying on a single contact at a target account slows deals down and increases risk if that person goes quiet. Multi-threading, or engaging multiple stakeholders early, keeps deals moving even when one contact stalls.
This approach is especially useful for increasing average deal size in B2B and enterprise sales, where committees make the final call. Reps who build relationships across departments close faster and face fewer last minute surprises, particularly when their broader sales workflow is optimized for faster deal closures.
Use Data-Driven Forecasting
Guessing at forecasts leads to missed targets and reactive planning. Data-driven forecasting uses historical sales velocity numbers to predict outcomes with far more accuracy than gut instinct alone.
Reviewing trends by rep, segment and deal size helps leaders spot shifts early, whether that is a slowing cycle or a strengthening win rate. This visibility turns forecasting into a reliable tool for planning average revenue months in advance.
Align SDR And AE Teams
Misalignment between SDRs and AEs creates gaps where good opportunities lose momentum during handoff. Shared goals and clear criteria for a qualified lead keep both teams working toward the same definition of success.
Regular syncs between SDRs and AEs help catch friction early, before it affects deal flow. This alignment consistently improves sales velocity numbers by keeping opportunities moving smoothly from first contact all the way to close.
How Do Sales Leaders Optimize Each Velocity Variable
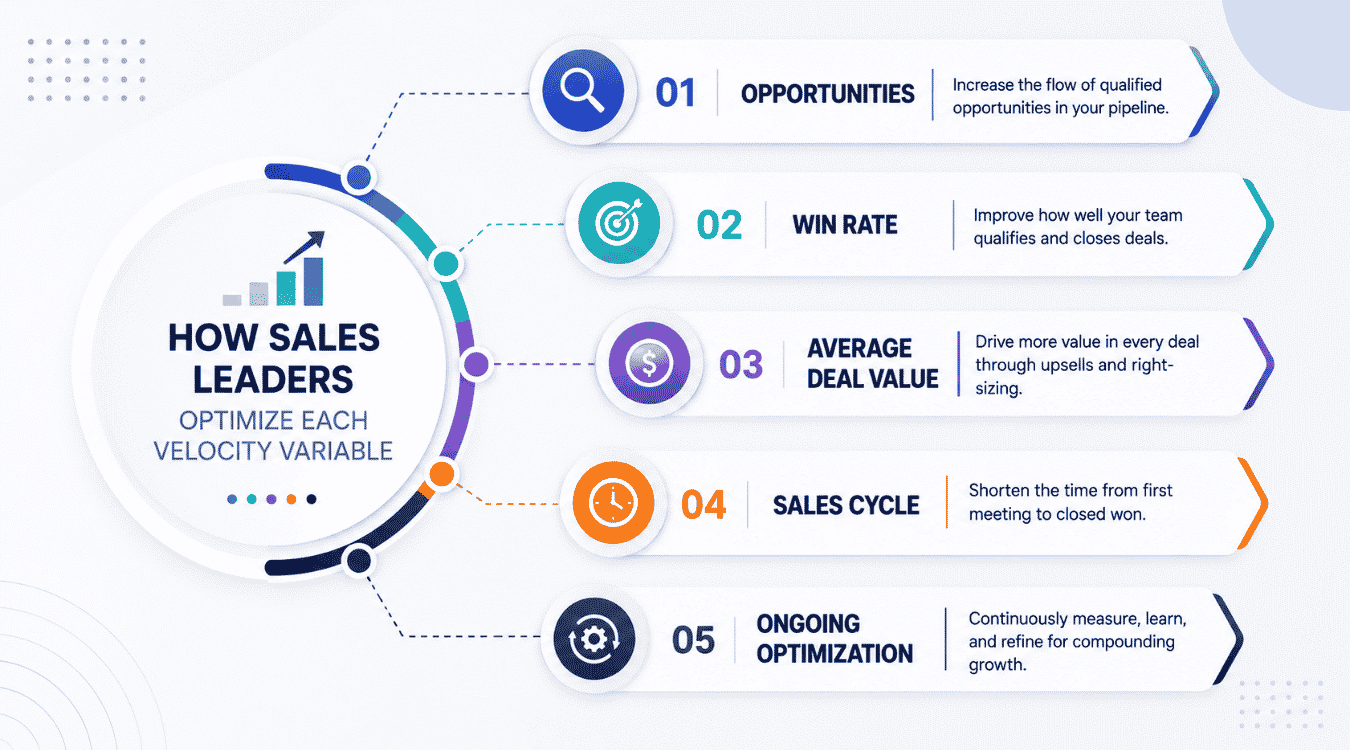
Sales leaders do not chase one number in isolation. They work each variable in the formula individually, since small gains across all four compound into a genuinely good sales velocity number.
Opportunities
Growing opportunity volume starts with consistent lead generation and disciplined qualification, not just more outreach. Leaders track this variable closely, since a shrinking pipeline is often the earliest warning sign of a revenue slowdown ahead.
To keep this number healthy, sales leaders review source quality alongside volume, not volume alone. Prioritizing channels that produce qualified opportunities, rather than just raw counts, keeps this input strong without inflating the pipeline artificially.
Win Rate
Win rate has an outsized effect on velocity, since deal value x win rate directly determines revenue output for any given cycle length. Leaders often find that improving this number moves the needle faster than adding more leads.
Sales leaders improve win rate by analyzing lost deals for patterns, then coaching reps on objection handling and positioning. Even a small percentage gain here noticeably increases total revenue generated over a quarter.
Average Deal Value
Deal value reflects how well a team sells value rather than competing purely on price. Leaders watch this closely, since a shrinking average often signals discounting pressure or a drift toward smaller, less strategic accounts.
To protect and grow this number, sales leaders push reps toward better qualified, higher fit accounts and encourage upsell conversations. Strengthening deal value alongside win rate creates a strong, sustainable revenue growth engine, especially when supported by a scalable sales process for growing teams.
Sales Cycle
Shorter, faster sales cycles directly increase velocity, since revenue arrives sooner even when other variables stay flat. Leaders map each stage carefully to find exactly where deals slow down or stall unnecessarily, often by designing custom sales stages for different teams.
Removing friction, tightening follow up and clarifying next steps all contribute to faster sales cycles. Leaders treat this variable as one of the easiest to influence quickly, since process fixes often show results within a single quarter.
Ongoing Optimization
No single fix keeps velocity strong forever, since markets, teams and buyer behavior all shift over time. Sales leaders treat velocity as a living metric, reviewing it regularly rather than checking it once and moving on.
This ongoing discipline means revisiting each variable, opportunities, win rate, deal value and cycle length, on a set schedule. Consistent review keeps a good sales velocity number sustainable instead of a one time result.
Best Practices Of Creating Sales Velocity
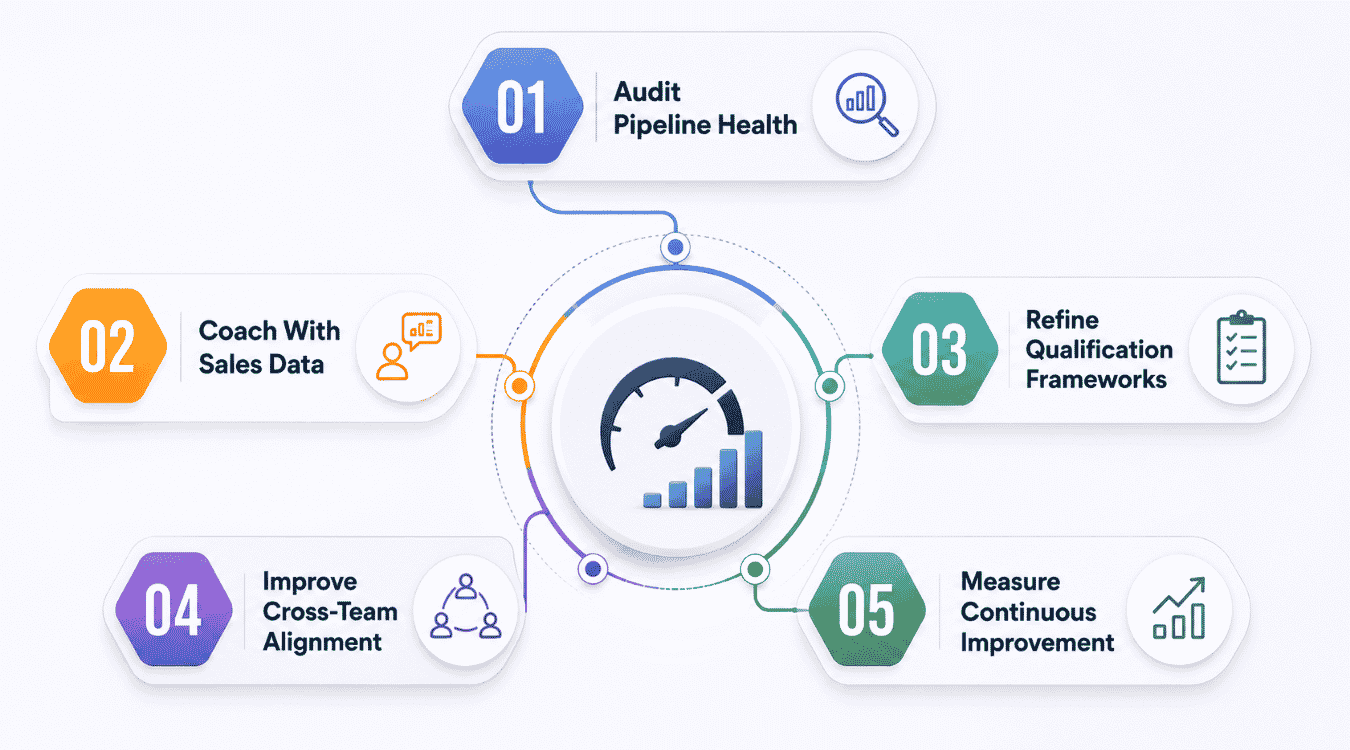
Building strong sales velocity is not a one time project. It comes from consistent habits around data, coaching and alignment that compound into faster, more predictable revenue over time.
Audit Pipeline Health
Regular pipeline audits reveal stalled deals, duplicate opportunities and outdated stage assignments that quietly distort velocity numbers. Cleaning this up first ensures every calculation reflects reality instead of inflated or stale data.
Many teams use automation tools to flag deals sitting untouched past a set threshold. This keeps the pipeline honest and gives leaders a clear, accurate view of how fast revenue is actually moving through each stage and how well they track deals from lead to close.
Coach With Sales Data
Coaching works best when it is grounded in real numbers rather than general advice. Reviewing individual rep data shows exactly where deals stall, whether that is qualification, negotiation or follow-up timing, and strong sales reporting in a CRM makes those patterns easy to see.
This approach helps reps understand how much revenue their own behavior influences, not just their close rate. Data backed coaching turns vague feedback into specific, actionable steps that directly help reps close deals faster.
Refine Qualification Frameworks
Qualification frameworks should evolve as your ideal customer profile and market shift over time. A framework that worked last year may quietly let in weaker leads that drag down revenue generated per rep.
Refining criteria around budget, authority and timing keeps opportunity data clean. This ongoing adjustment helps teams set realistic sales goals based on the quality of leads actually entering the pipeline, not last year's assumptions.
Improve Cross-Team Alignment
Sales velocity suffers when marketing, SDRs, AEs and customer success all define success differently. Misaligned handoffs and inconsistent lead definitions create friction that slows deals down before they ever reach a close, highlighting the value of a unified sales collaboration CRM for team alignment.
Shared definitions and regular cross-team syncs keep everyone working toward the same numbers. This alignment makes it easier to trace exactly how fast revenue moves from first touch to closed deal, without conflicting reports.
Measure Continuous Improvement
Sales velocity is not a metric to calculate once and forget. Reviewing it monthly or quarterly shows whether recent changes are actually helping or simply shifting the problem to a different stage, something that becomes clearer with visual sales pipeline software to manage deals.
Tracking trends over time helps leaders see real progress beyond a single strong month. This consistent measurement turns sales velocity into a long term habit that keeps revenue generated predictable and continuously improving, especially when supported by a visual sales pipeline that improves deal clarity.
Final Discussion
Sales velocity works best when it is treated as a habit, not a one time calculation. Tracking opportunities, win rate, deal value and sales cycle length together gives a clear, honest picture of how revenue actually moves through your pipeline. Small improvements in any single variable often produce outsized results, especially when qualification and handoffs are tightened at the same time.
The real value comes from consistency. Reviewing velocity monthly, coaching with real data and refining qualification as your market shifts keeps the metric useful rather than stale. Teams that build this rhythm into their sales process gain a dependable way to forecast revenue and grow faster with far less guesswork.
Frequently Asked Questions
What Is A Good Sales Velocity Benchmark?
There is no universal number, since benchmarks vary by industry, deal size and sales motion. A healthy velocity trends upward over time and matches or beats your revenue targets, rather than a fixed figure copied from another company.
How Often Should You Calculate Sales Velocity?
Most teams review it monthly or quarterly, since shorter windows can be skewed by a few large or small deals. Fast-moving SaaS or B2C teams sometimes track it weekly, while enterprise sales usually benefit from a longer, rolling view.
Can Sales Velocity Be Negative Or Zero?
Velocity itself will not go negative, but it can drop close to zero if win rate collapses or the pipeline runs dry. A near-zero result is a strong signal to pause and investigate qualification, follow-up, or lead flow immediately.
What Tools Help Track Sales Velocity Automatically?
Most modern CRMs calculate this automatically once deal stages, values and close dates are logged consistently. Clean, disciplined data entry matters more than the specific tool, since incomplete records will distort every part of the formula.
Does Sales Velocity Apply To One-Time Sales Businesses?
Yes, though it looks slightly different without recurring revenue. One-time sales businesses still benefit from tracking deal count, value, win rate and cycle length, since it reveals the same bottlenecks and helps forecast revenue just as effectively.