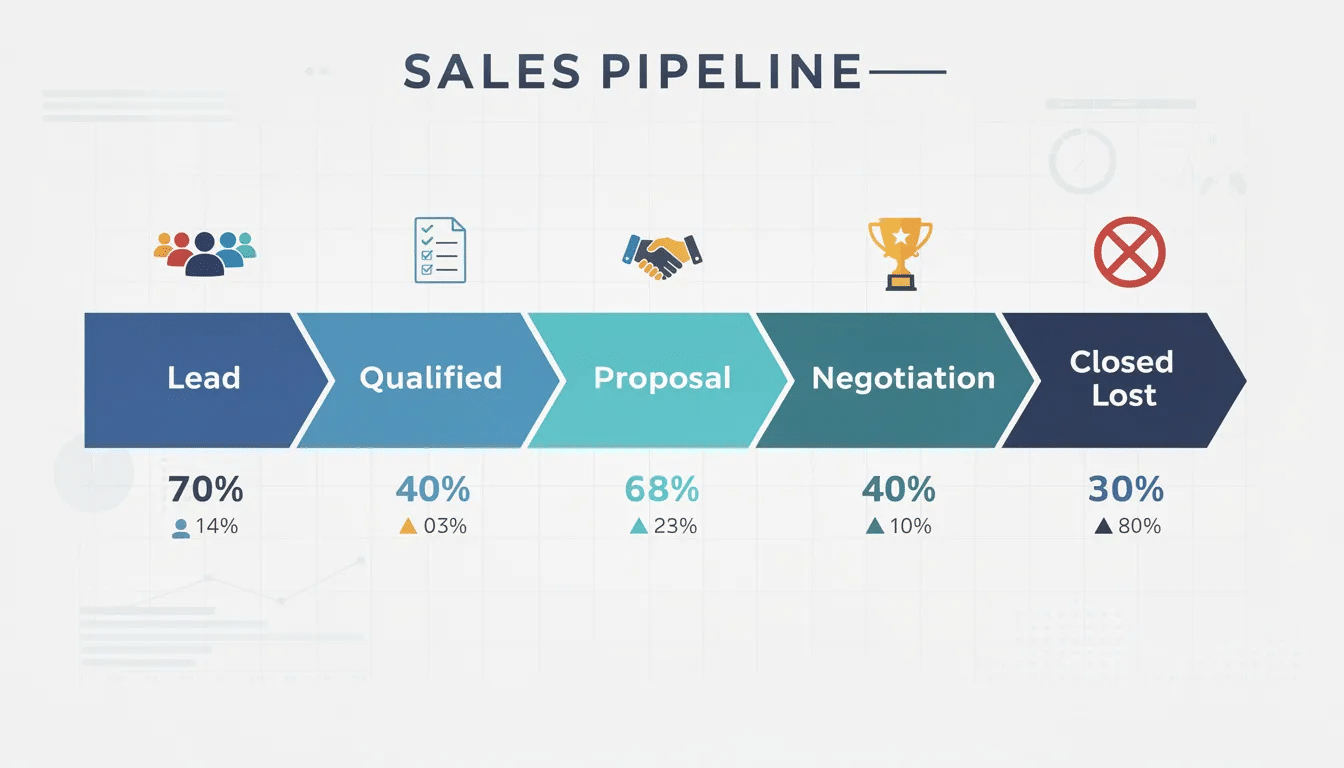
Account-based selling helps B2B sales teams focus on the accounts that matter most. Instead of chasing many leads, the sales team targets specific high-value accounts with strong revenue potential. Sales and marketing teams work together to identify a target account list and build a unified strategy around those companies.
A strong account-based selling strategy aligns marketing efforts, sales outreach, and account management. Sales reps engage key stakeholders and multiple decision makers with personalized messaging and tailored solutions. This targeted approach improves account engagement, increases average deal size, and builds stronger customer relationships.
A clear account-based sales process helps sales organizations win key accounts and drive sustainable revenue growth.
What Is Account-Based Selling
Account-based selling is a targeted B2B sales strategy that focuses on specific high-value accounts instead of a wide pool of potential customers. A sales team works closely with marketing teams to identify high-value accounts and create a target account list. The account-based selling model aligns sales and marketing efforts, so both teams pursue the same target company. Each outreach uses personalized messaging built around buyer personas, pain points, and the needs of key decision makers.
An account-based selling strategy treats a target account as a market of its own. Sales reps, account managers, and marketing and sales teams collaborate through the entire sales process. The account-based sales process often involves multiple stakeholders and longer sales cycles. A unified strategy helps teams build account plans, support the buying process, and win key accounts with tailored solutions.
Account-based selling requires close coordination across the entire team, including customer success teams and account executives. Sales organizations use customer relationship management tools or an account-based selling platform to track account engagement and key metrics. A strong account-based approach increases average deal size, improves customer lifetime value, reduces customer acquisition costs, and builds long term relationships that support sustainable revenue growth.
How to Identify High-Value Target Accounts
High-value target accounts form the foundation of a successful account-based selling strategy. A clear process helps sales and marketing teams focus on companies with the highest revenue potential. Careful selection improves deal size, shortens sales cycles, and builds stronger customer relationships.
Ideal Customer Profile
An ideal customer profile helps the sales team focus on the right target company. The profile defines firmographic data such as company size, industry, revenue, and geographic market. Sales organizations also review buying capacity and technology stack. This step helps identify high-value accounts that match long-term revenue goals.
Research from HubSpot shows that companies with a defined ideal customer profile can increase conversion rates by more than 20%. Sales reps use the profile to build a strong target account list. A clear ICP also helps marketing teams develop better marketing campaigns and personalized messaging for key stakeholders.
Revenue And Deal Size Potential
High-value target accounts often show strong revenue potential. Sales teams analyze average revenue, expected deal size, and long-term customer lifetime value. Large organizations or fast-growing companies usually offer higher contract values.
According to Forrester, account-based sales strategies often increase average deal size by about 35%. Sales reps focus on accounts where the buying process involves multiple decision makers and larger budgets. A targeted approach allows the account team to prioritize companies that can generate sustainable revenue growth.
Strategic Industry Fit
Industry fit plays a major role in account-based selling. Sales organizations should focus on industries where their product solves clear pain points. Strong industry alignment helps marketing and sales teams create tailored solutions and relevant sales collateral.
A study from ITSMA reports that 87% of marketers say account-based marketing delivers higher ROI than traditional marketing efforts. Marketing teams and sales reps collaborate to analyze market demand, industry trends, and competitive landscape, often supported by a CRM that helps sales teams manage and prioritize leads. A unified strategy helps both teams target high-value accounts with a higher probability of success.
Account Engagement Signals
Account engagement shows how interested a target account may be. Sales teams review website visits, content downloads, demo requests, and responses to marketing campaigns. Customer relationship management tools and sales activity tracking software and an account-based selling platform help track these signals.
Research from Demandbase shows that companies with strong account engagement are 2.5 times more likely to move forward in the buying process. Account managers and sales reps use this data to identify potential customers with real buying intent. A higher engagement level often means shorter sales cycle length.
Stakeholder And Buying Power
Many enterprise deals involve multiple stakeholders and key decision makers. High-value accounts usually have a structured buying process and defined budget owners. Sales teams must evaluate who controls the purchase and how many departments participate.
A Gartner study shows that an average B2B buying group involves six to ten decision makers. Account-based selling requires a clear mapping of key stakeholders within the target account. Sales reps and account executives build relationships with those contacts. Strong engagement across decision makers increases win rates and helps sales teams win key accounts.
Account-Based Selling Strategy Framework
A clear framework helps teams execute an effective account-based selling strategy. Sales and marketing teams align their efforts around high-value accounts and specific accounts. A structured model keeps the entire sales process organized and focused on the right opportunities.
Target Account List
A strong account-based selling strategy begins with a clear target account list. Sales and marketing teams identify high-value target accounts that match the ideal customer profile. The focus stays on companies that show strong revenue potential and strategic fit.
Sales reps and account managers review firmographic data, industry alignment, and company growth signals. The goal is to identify high-value accounts that justify deeper attention, then manage them through a visual sales pipeline for better deal clarity. A focused list helps sales organizations move away from traditional sales methods and toward a targeted approach that prioritizes specific high-value accounts.
Account Research
Account research helps the sales team understand a target company before outreach begins. Sales reps review company goals, industry challenges, and possible pain points. The process also includes identifying key stakeholders, key decision makers, and multiple stakeholders involved in the buying process.
A deeper view of the organization supports strategic account management. Sales teams map the structure of the company and the roles of decision makers, then align them to custom sales stages and scalable pipelines. This insight allows the account team to prepare relevant sales collateral and tailored solutions that fit the needs of the target account.
Personalized Outreach
Personalized messaging plays a major role in the account-based selling approach. Marketing teams and sales reps create communication that speaks directly to the needs of specific accounts. The goal is to connect marketing efforts with the sales process.
Account-based sales rely on messages that address pain points and priorities. Sales reps often reach out to multiple decision makers with tailored solutions. Personalized outreach helps build trust with key stakeholders and improves account engagement throughout the buying process.
Sales And Marketing Alignment
Account-based selling requires close collaboration between marketing and sales teams. Both groups align sales strategies and marketing campaigns around shared target accounts. A unified strategy ensures that marketing efforts support the sales team at every stage.
Marketing teams create targeted campaigns and content for high-value accounts. Sales reps and account executives use those materials during conversations with potential customers. Alignment between marketing and sales teams helps sales organizations maintain consistent messaging and improve the account-based sales process.
Account Management And Expansion
Account management remains important after a deal closes. Account managers and customer success teams continue to build relationships with existing customers. The focus shifts toward long-term relationships and higher customer lifetime value.
Customer success teams support account engagement and identify new opportunities within key accounts by leveraging sales task automation to stay organized. Account plans help guide expansion across departments or business units. A strong account-based sales strategy supports growth through larger deal size, stronger customer relationships, and sustainable revenue from key accounts.
How To Execute Your Account-Based Prospecting Plan
A strong prospecting plan turns an account-based selling strategy into real opportunities. Sales and marketing teams focus on specific accounts and coordinate outreach. A clear plan helps sales reps engage key stakeholders, build relationships, and move target accounts through the sales process.
Target Account Research
A successful account-based prospecting plan starts with detailed research. Sales reps study the target company, industry challenges, and business priorities. The goal is to understand pain points and identify opportunities where tailored solutions can create value.
Sales teams also map key stakeholders and key decision makers inside the account using lead management software to track and convert prospects. Many enterprise deals involve multiple stakeholders across departments. Clear insight helps the account team prepare personalized messaging and relevant sales collateral before outreach begins.
Prospect Mapping
Prospect mapping helps the sales team understand who influences the buying process. A target account often includes several decision makers, technical evaluators, and budget owners. Sales reps and account executives must identify each role within the organization.
Customer relationship management tools for contact management help track contacts and relationships within specific accounts. Account managers and sales reps review organizational structures and communication paths. This step ensures the account-based sales process reaches the right people at the right time.
Personalized Outreach
Personalized outreach sits at the center of the account-based selling approach. Sales reps craft messages for specific accounts instead of broad prospect lists. Outreach highlights pain points, business goals, and opportunities that matter to the target company, reinforced by a CRM with email integration that streamlines sales communication.
Marketing teams support outreach with targeted marketing campaigns and relevant sales collateral. Personalized messaging often includes insights about the industry or challenges the account faces. A tailored message builds trust and helps sales reps start meaningful conversations with potential customers.
Multi-Channel Engagement
An effective prospecting plan uses several communication channels. Sales reps connect with decision makers through email, phone, professional networks, and events. Each channel supports account engagement and strengthens relationships with key stakeholders.
Marketing efforts also support outreach through targeted campaigns and helpful content. Marketing and sales teams work together to keep communication consistent. A coordinated approach increases visibility within high-value accounts and improves the chances of winning key accounts.
Pipeline Progress Tracking
Pipeline tracking helps the entire team understand how target accounts move through the sales cycle. Sales organizations track account engagement, deal size, and the progress of each opportunity. Customer relationship management systems that track deals from lead to close help monitor activity within the account-based sales process.
Account managers and sales reps review key metrics to evaluate progress. Teams adjust the sales strategy when engagement slows or decision makers change priorities. Clear tracking helps maintain momentum and ensures the account-based prospecting plan supports sustainable revenue growth.
Content Strategy For High Value Account Engagement
Content plays a pivotal role when you want to engage prospects and deliver customized value in account-based selling, especially when supported by a simpler, CRM-driven sales workflow. You need to understand their needs, business challenges, and goals to tailor your content for each prospect. Perform research on target accounts to uncover key decision makers, personas, and pain points within each target account. This information is the foundation for building customized content strategies that strike a chord with each stakeholder.
Customize Content For Different Buyer Personas
Craft unique messaging that speaks to the specific challenges and needs of each account. About 90% of sales come from just three or four customer types. You need only three to four buyer personas to get started. Create persona-specific content tailored to the interests, needs, and behaviors of particular buyer personas. CFOs prioritize ROI and financial metrics. Technical evaluators assess integration capabilities. Operations teams focus on workflow improvements and implementation ease. Therefore, your sales and marketing teams must develop separate content tracks that address each stakeholder's distinct priorities. Content mapping ensures you place the right content in front of the right people.
Use Case Studies And Proof Points For Enterprise Sales
Proof points help move individual opportunities forward and gain the attention of prospects while mitigating purchasing risk. Case studies demonstrate the value and differentiation of your solutions. Develop a proof point database that tags proof points by qualifying characteristics like value driver, differentiator, buyer type, and product.
Create detailed case studies that highlight successful implementations with quantitative and qualitative data. Use testimonials from satisfied customers as powerful tools to build credibility. Make sure proof points line up with prospect requirements and positive business outcomes. Map proof points to buyer factors your salespeople uncover.
Deliver Value At Every Touchpoint
Share content at critical moments in the buyer's experience to build interest and engagement. Distribute content across multiple channels like email, social media, direct mail, and webinars. Track how target accounts interact with your content to refine future strategies. Monitor key metrics like click-through rates, open rates, and conversion rates to identify what strikes a chord best.
How To Optimize Your Targeted Account Selling Results
Metrics show whether an account-based selling strategy produces real results. Sales organizations rely on clear key performance indicators to evaluate sales and marketing efforts. Accurate data helps the entire team refine the account-based sales strategy and focus on high-value accounts.
Account Engagement And Pipeline Velocity
Account engagement reveals how well marketing and sales teams connect with target accounts. Sales reps track interaction across key stakeholders and multiple decision makers within a target company, using sales activity metrics as leading indicators of pipeline health. Strong account engagement often includes communication with five or more contacts from the buying group.
Pipeline velocity measures how quickly opportunities move through the sales process. Sales organizations review deal size, win rates, and sales cycle length to evaluate performance, similar to how a B2B SaaS startup used Gain.io to close deals faster and improve pipeline velocity. Faster movement through the pipeline often signals strong alignment between marketing teams, sales teams, and the account-based selling approach.
Deal Size And Conversion Rates
Deal size remains an important metric in account-based sales. High-value accounts usually produce larger contracts and higher average revenue. Sales teams compare deal size from account-based approaches with results from traditional sales methods.
Conversion rates also show how effective the account-based sales process is. Sales reps track movement between stages of the buying process. Low conversion often signals gaps in personalized messaging, sales collateral, or account engagement with key stakeholders.
Customer Lifetime Value
Customer lifetime value measures long term revenue from a single account. Sales teams calculate the average revenue generated during the entire customer lifetime. Strong account based selling often increases value because it focuses on long term relationships with key accounts.
Customer success teams and account managers support retention and expansion with integrated contact management that strengthens relationships. Strong collaboration between marketing and sales teams improves account engagement after the initial deal. Growth within existing customers often leads to larger deal sizes and stronger account management outcomes.
Return On Investment
Return on investment helps evaluate the financial impact of account based sales strategy. Sales organizations compare revenue from new customers and existing customers against the cost of marketing campaigns and sales efforts, often relying on a sales pipeline CRM to improve visibility and forecasting.
Account-based selling usually focuses on specific high-value accounts. A targeted approach often reduces customer acquisition costs and increases average deal size by improving sales visibility into pipeline performance. Sales leaders review ROI to ensure the account-based selling platform, sales strategy, and marketing efforts generate sustainable revenue growth.
Strategy Optimization
Performance data helps refine the account-based selling strategy. Sales organizations analyze key metrics such as account engagement, sales cycle length, and conversion rates across target accounts. Insights from data highlight which industries or segments produce the strongest results.
Sales reps and account managers use those insights to improve account plans and target account lists. Marketing teams adjust marketing campaigns and personalized messaging for better engagement. Continuous adjustments across the entire team help sales organizations win key accounts and strengthen long-term relationships.
How Gain.io Supports Account-Based Selling Success
Gain.io supports a structured account-based selling approach by giving sales and marketing teams a clear view of target accounts. Sales reps and account managers can organize contacts, track deals, and monitor account engagement in one platform. The system helps teams build a focused target account list and manage relationships with key stakeholders and multiple decision makers inside a target company.
The platform also supports the entire sales process with pipeline tracking and customer relationship management tools. Sales teams can monitor deal size, sales cycle length, and key performance indicators for high-value accounts. Marketing teams align marketing efforts with the sales strategy and deliver personalized messaging for specific accounts.
A unified workspace with smart CRM tools for sales teams helps the entire team manage account plans, sales collateral, and outreach across the account-based sales process. Better visibility helps sales organizations identify high-value target accounts, strengthen customer relationships, and drive sustainable revenue growth through account-based sales.
FAQs
Can Account-Based Selling Work For Small Sales Teams?
Yes. Account-based selling can work well for small sales teams. A focused account-based sales strategy allows teams to prioritize specific high-value accounts instead of chasing many leads, especially when paired with a CRM built for startups and small sales teams. Sales reps can build stronger customer relationships and improve deal size through a targeted approach.
Does Account-Based Selling Require A Dedicated Platform?
No. Account-based selling does not always require a dedicated account-based selling platform. Sales organizations can start with a customer relationship management system to track target accounts, account engagement, and key stakeholders.
Is Account-Based Selling Better Than Traditional Sales Methods?
Yes. Account-based selling often performs better than traditional sales methods for complex B2B deals. The account-based approach focuses on specific high-value accounts, multiple decision makers, and personalized messaging. This sales strategy often leads to higher deal size and stronger customer lifetime value.
Can Account-Based Selling Improve Customer Retention?
Yes. Account-based sales strategies often strengthen long-term relationships with existing customers. Account managers and customer success teams stay engaged with key accounts and key stakeholders. Strong account management and tailored solutions help increase customer lifetime and expansion revenue.
What Challenges Do Sales Teams Face In Account-Based Selling?
Sales teams often face challenges with sales and marketing alignment and account research. Multiple stakeholders and complex buying processes can slow sales cycles. A clear target account list, strong account plans, and a unified strategy help sales organizations manage high-value target accounts effectively.
AI sales assistant software has become an important tool for revenue teams that want to improve pipeline efficiency and accelerate deal progress. Many organizations now rely on sales assistant software powered by generative AI, predictive analytics, and intelligent automation to analyze sales data and uncover new sales opportunities.
The best AI sales assistants combine AI agents, automated lead management, and real-time actionable insights to help sales teams move deals forward faster. These systems track signals such as job changes, engagement behavior, and buyer activity while maintaining sender reputation during outreach campaigns.
Modern AI sales assistant software also connects with tools such as Google Sheets and other platforms to simplify data sharing across revenue teams. Even with advanced automation, successful AI assistants still preserve the human touch in sales conversations. Many platforms offer a free plan or standalone functionality so organizations can test AI-driven sales workflows while pursuing long term sales goals.
What Is An AI Sales Assistant In Revenue Teams
An ai sales assistant is intelligent software that supports sales reps throughout the entire sales process. It uses artificial intelligence and machine learning to analyze sales data, prioritize leads, and automate outreach. Think of it as a virtual assistant that works alongside your team, not instead of them.
The technology relies on natural language processing to understand communication patterns and generate human-like responses. It connects to your CRM, email, and calendar to build a complete picture of every opportunity. Unlike basic automation tools, modern ai assistants learn from your pipeline history, pricing rules, and deal outcomes to provide context-aware recommendations.
For revenue teams, this means sales managers get instant insights into pipeline health. Sales reps receive suggestions on who to contact first and what to say. Decision makers get summaries of complex deals without digging through notes. The ai assistant handles research, drafts follow up emails, logs activities, and flags risks so nothing falls through the cracks, much like dedicated sales task automation tools designed to keep teams focused and organized.
According to industry data, ai powered tools can identify high-potential leads and suggest optimal times for outreach based on engagement patterns. This helps gtm teams focus energy on prospects most likely to convert rather than spreading efforts thin across every lead.
AI Sales Assistant To Improve Pipeline Efficiency
Pipeline efficiency determines how quickly revenue teams move deals from first touch to closed won. Here is how ai sales assistants strengthen each stage of the sales pipeline.
Sales Pipeline Visibility For Revenue Teams
Visibility into the sales pipeline is foundational for revenue teams. Without clear insight into deal status, sales leaders struggle to forecast accurately or allocate resources effectively.
Ai sales assistants solve this by aggregating data from multiple sources into a single view. They pull information from CRM records, email threads, call summaries, and calendar events. This gives sales managers a real-time picture of where every opportunity stands.
Research indicates that teams using ai powered pipeline tools see improvements in forecast accuracy because the data is updated continuously rather than relying on manual rep input. When sales call data flows directly into the system, managers spot trends earlier and adjust their sales strategy accordingly, especially when supported by a dedicated sales visibility CRM that surfaces real-time insights for managers.
For growing SaaS companies, this visibility is critical. Complex sales cycles with multiple stakeholders require constant monitoring. An ai assistant tracks engagement across contacts and surfaces which deals need attention today, not after the weekly pipeline review.
Lead Prioritization Based On Buyer Signals
Not all leads deserve equal attention. Ai sales assistants analyze lead data and engagement patterns to score prospects based on buying signals.
When a prospect asks about pricing, requests product demos, or responds quickly to outreach, the ai recognizes these behaviors and flags the lead as high-priority. This lead scoring happens in real-time, allowing reps to qualify prospects faster.
Sales intelligence tools within ai assistants examine historical win/loss data to predict which leads are most likely to convert. They look at factors like company size, industry, engagement frequency, and past deal outcomes. The result is a ranked list that helps reps focus on high quality leads first, similar to how a well-implemented CRM helps sales teams manage leads throughout the funnel.
Studies show that teams using ai for lead prioritization see higher conversion rates because they spend time on prospects who are ready to buy rather than chasing cold outreach that goes nowhere. This approach also improves rep performance by reducing wasted effort on low-probability opportunities.
Deal Progress Across Pipeline Stages
Tracking deal velocity across pipeline stages reveals where opportunities stall. Ai assistants monitor movement and alert reps when deals sit too long in one stage.
For example, if an opportunity stays in the negotiation stage beyond the average cycle time, the ai flags it for review. It might suggest re-engaging a specific contact or recommend next steps based on similar past wins.
This proactive approach keeps deals moving forward. Sales assistants can even identify missing stakeholders in multi-threaded deals, helping reps avoid blind spots late in the cycle when new decision makers suddenly appear.
Automated workflows triggered by stage changes ensure follow ups happen on schedule. The ai sends reminders, drafts emails, and updates records so reps stay focused on selling rather than administrative tasks, mirroring the benefits of sales task automation tools that boost productivity and revenue.
Early Detection Of Stalled Opportunities
Stalled deals are silent revenue killers. Ai sales assistants continuously identify opportunities at risk before they become losses.
They analyze engagement patterns, response times, and sentiment from sales calls to detect warning signs. If a champion stops responding or if meeting attendance drops, the assistant surfaces the risk immediately.
This early detection gives sales teams time to intervene. A rep might schedule a check-in call, involve leadership, or adjust the proposal based on new objections. Without ai monitoring, these signals often go unnoticed until the deal is already lost.
Pipeline risk detection is one of the most valuable capabilities for sales leaders. It reduces surprises at quarter end and helps managers coach reps on deals that still have a chance.
Sales Insights Without Manual Analysis
Manual pipeline analysis is time consuming and often outdated by the time reports are complete. Ai assistants generate valuable insights automatically from ongoing sales activities, supporting stronger tracking of key sales performance metrics for SaaS teams.
They summarize key information from calls, highlight changes in deal status, and surface patterns across the pipeline. Sales leaders get dashboards updated in real-time rather than waiting for weekly data pulls.
This automation frees RevOps teams from building reports manually. Instead, they focus on strategy and optimization while the ai handles data aggregation and analysis.
Ai insights also improve coaching. Managers see which reps struggle with specific deal stages and can offer targeted support. Live coaching during calls provides on-the-fly guidance based on conversation analysis, helping reps handle objections more effectively.
Focus On High Value Sales Activities
The ultimate goal of any ai sales assistant is to let sales reps spend more time on activities that close deals. By automating repetitive tasks like data entry, meeting scheduling, and follow up emails, the ai reclaims hours each week.
Reps use this time for discovery calls, building relationships, and negotiating with decision makers. These high value activities require human judgment and cannot be delegated to automation, but they are amplified when teams use a focused CRM to improve sales productivity.
Research suggests that sales teams using ai tools spend significantly more time selling and less time on administrative work. This shift improves win rates and accelerates deal cycles because reps engage prospects more consistently.
For revenue teams, the combination of automated prospecting, ai features for prioritization, and streamlined workflows creates a sustainable advantage. Reps feel less burned out, managers gain better visibility, and the organization closes more deals with the same headcount.
Sales Pipeline Data Challenges In Growing SaaS Companies
Growing SaaS companies face unique obstacles when scaling their sales operations. Data fragmentation and visibility gaps slow down pipeline efficiency.
Pipeline Data Scattered Across Sales Tools
Most sales organizations use multiple tools for different functions. CRM systems hold contact records. Email platforms store conversation history. Calling tools capture sales calls. Calendar apps track meetings.
This fragmentation creates silos. Sales reps waste time switching between applications and manually entering information into the CRM. Important details get lost or entered inconsistently.
Ai sales assistants address this by connecting to other systems and pulling data into a unified view. They sync information automatically so reps and managers see the complete picture without manual reconciliation, much like a dedicated sales pipeline CRM that centralizes data for better visibility and performance.
For companies with existing sales workflows, integration depth matters. An ai assistant that works within your current tech stack adds value immediately. One that requires replacing tools or manual data migration creates friction.
Limited Visibility Into Buyer Engagement
Understanding how prospects engage with your company across channels is essential for timing outreach correctly. Many teams lack this visibility because engagement data sits in separate systems.
Email opens, website visits, content downloads, and call recordings all provide signals about buyer interest. Without aggregation, sales reps miss patterns that indicate readiness to buy.
Ai assistants consolidate engagement data and highlight trends. They might surface that a prospect visited the pricing page three times this week or downloaded a case study relevant to their industry. These insights help reps tailor conversations and strike while interest is high, especially when combined with a CRM with email integration that tracks engagement automatically.
Limited visibility also affects lead generation. Marketing qualified leads may go cold because sales does not act fast enough. Ai tools reduce lead response time from hours to minutes, capturing interest before it fades.
Delays In Pipeline Analysis For Sales Leaders
Sales leaders need timely data to make decisions. Monthly pipeline reviews are too slow in fast-moving SaaS markets.
Traditional reporting requires pulling data, cleaning it, and building visualizations. By the time the report is ready, the pipeline has changed. Opportunities have moved, stalled, or closed.
Ai assistants provide real-time analytics that update continuously. Managers see current pipeline health whenever they need it. They identify problems early and adjust strategy without waiting for scheduled reviews, which accelerates CRM adoption that is changing modern sales teams into more data-driven organizations.
This speed advantage compounds over time. Teams that react quickly to pipeline risks save more deals and maintain forecast accuracy even as market conditions shift.
Inconsistent CRM Data Across Revenue Teams
CRM data quality is a persistent challenge. Different reps enter information differently. Fields get skipped. Updates lag behind reality.
Inconsistent data undermines everything downstream. Lead scoring models produce unreliable results. Forecasts miss the mark. Reporting shows incomplete pictures.
Ai assistants improve data quality by automating data entry and standardizing records. They capture information from emails, calls, and meetings and log it consistently. They also flag missing data and prompt reps to complete records.
For revenue teams, cleaner data means more trustworthy insights. Sales leaders make better decisions when they know the underlying information is accurate and current.
Missed Opportunities In Complex Sales Cycles
Complex B2B deals involve multiple stakeholders, long timelines, and numerous touchpoints. Keeping track of everything manually is nearly impossible.
Opportunities slip through cracks when reps forget to follow up, miss a stakeholder, or lose track of objections raised months ago. These missed steps cost revenue.
Ai sales assistants maintain comprehensive deal histories. They surface action items, remind reps of pending follow ups, and track stakeholder engagement across the buying committee. Nothing gets lost.
For companies selling to enterprise accounts, this capability is essential. The ai assistant becomes the memory of the deal, ensuring continuity even when reps transition or accounts get reassigned, especially when layered on top of a simpler sales workflow in your CRM that keeps every step organized.
Product Usage Signals That Strengthen Sales Pipelines
Product data offers powerful signals that traditional sales software often overlooks. Companies that connect product engagement to pipeline analysis gain a meaningful advantage.
Product Engagement Signals In Sales Conversations
How prospects and customers use your product tells you a lot about their readiness to buy or expand. High engagement indicates value realization. Low engagement suggests churn risk.
Sales reps can use engagement signals to personalize conversations. If a trial user has explored advanced features, the rep knows to focus on those capabilities during the demo. If usage has dropped, the rep can address concerns before they become objections.
Ai assistants surface these signals automatically. They pull product data and present it alongside CRM records so reps have context before every call. This preparation makes conversations more relevant and builds trust with potential customers.
Product Qualified Leads In Revenue Pipelines
Product qualified leads are prospects who demonstrate buying intent through product usage. They have tried your solution and engaged meaningfully, making them stronger candidates than leads based on marketing engagement alone.
Identifying PQLs requires connecting product analytics to sales pipelines. Ai tools analyze usage patterns and flag leads that meet qualification criteria. They might look at feature adoption, time spent in the product, or specific actions that correlate with conversion.
Revenue pipelines that incorporate PQLs see higher win rates because these leads have already experienced value. Sales reps spend less time convincing and more time facilitating the purchase decision, particularly when supported by thoughtful contact segmentation in sales that reflects product behavior and buying stage.
Customer Behavior Data For Opportunity Scoring
Beyond initial qualification, customer behavior data informs opportunity scoring throughout the sales cycle. Ongoing usage patterns reveal whether a deal is progressing positively or at risk.
For expansion opportunities, ai assistants track which features customers use and which they ignore. This data guides upsell and cross-sell conversations. If a customer heavily uses one module but ignores another, the rep knows where to focus, especially when those insights are tied into Gain.io features and smart CRM tools that surface usage patterns alongside deal data.
Behavior data also supports renewal forecasting. Declining usage often predicts churn. Early detection gives customer success and sales teams time to intervene before the contract ends.
Product Insights For Sales And RevOps Teams
Sales and RevOps teams benefit from product insights beyond individual deals. Aggregate data reveals patterns about what drives conversions, which features resonate, and where friction exists.
These insights inform go to market strategy. If certain product capabilities correlate with faster deal cycles, marketing can emphasize them in campaigns. If onboarding friction slows adoption, product teams can prioritize improvements.
Ai assistants make this analysis accessible without requiring data science expertise. They surface trends and anomalies automatically, enabling teams to act on insights quickly.
Customer Adoption Signals In Deal Progress
Adoption milestones mark meaningful progress in the customer journey. Reaching these milestones during a trial or pilot indicates deal momentum.
Ai sales assistants track adoption signals and incorporate them into pipeline views. A prospect who completes onboarding, invites team members, or integrates with other systems shows commitment that verbal interest alone does not convey.
Sales reps use adoption data to gauge deal health and prioritize where to invest time. Strong adoption signals justify continued pursuit. Weak signals prompt conversations about barriers or fit.
Product Intelligence For Revenue Forecasting
Revenue forecasting improves when product data supplements pipeline data. Usage patterns add a dimension of insight that CRM records alone cannot provide.
Forecasts based on stage and probability miss nuance. A deal marked as 80% likely might be at risk if product engagement has dropped. Conversely, a 50% deal might be stronger than expected if usage is accelerating.
Ai sales agents incorporate product intelligence into forecasting models. They weight opportunities based on engagement, not just rep confidence. This approach produces more accurate forecasts and reduces quarter-end surprises for sales leaders.
Revenue Operations And Sales Alignment Through Data
Revenue operations and sales teams achieve better outcomes when they share data and work from a common understanding of pipeline health.
Revenue Data Visibility Across Teams
When RevOps and sales see the same data, alignment improves. Disputes about pipeline numbers disappear. Conversations shift from data accuracy to strategy.
Ai assistants create this shared visibility by aggregating data from all relevant sources. Dashboards show consistent metrics whether viewed by a rep, manager, or RevOps analyst, often through a visual sales pipeline that improves deal clarity for everyone involved.
This transparency builds trust. Sales leaders know RevOps reports reflect reality. RevOps knows sales inputs are complete. Everyone works from the same truth.
Sales And RevOps Collaboration Around Pipeline Data
Collaboration becomes productive when both teams access the same information. RevOps can identify pipeline gaps without waiting for sales to provide data. Sales can request analysis without lengthy data preparation.
Ai tools facilitate this collaboration by surfacing insights proactively. They might alert RevOps to a coverage gap in a territory or flag an unusual pattern in deal velocity. Both teams can investigate and respond together.
Effective collaboration also improves process adherence. When sales sees how their inputs affect forecasts and reports, they are more motivated to maintain data quality, especially when using robust contact management to build stronger relationships across the team.
Pipeline Health Monitoring Through Analytics
Pipeline health encompasses more than total value. It includes coverage ratios, stage distribution, velocity, and risk indicators.
Ai assistants monitor these dimensions continuously. They compare current metrics to historical benchmarks and alert managers when something looks off. This proactive monitoring catches problems before they impact revenue and depends on tracking the right sales performance metrics for SaaS teams in a CRM that truly fits your workflow, which is why choosing CRM tools that match your process is so important.
Health analytics also support coaching conversations. Managers use pipeline data to identify which reps need support and what specific behaviors to address. Data-driven coaching is more effective than intuition-based feedback.
Data Driven Sales Forecast Planning
Forecasting accuracy is a persistent challenge for sales organizations. Deals slip, close early, or die unexpectedly. Traditional forecasting relies heavily on rep judgment, which varies in reliability.
Ai sales assistants improve forecasts by analyzing historical patterns and weighting current deals accordingly. They consider factors like stage duration, engagement trends, and stakeholder involvement.
The result is a forecast grounded in data rather than optimism. Sales leaders can plan resources, set quotas, and communicate with executives more confidently.
Opportunity Insights For Strategic Sales Decisions
Strategic decisions require understanding which opportunities matter most and why. Ai assistants surface opportunity insights that inform resource allocation.
They might reveal that deals with certain characteristics close faster or at higher values. This insight guides targeting and qualification criteria. Reps learn which prospects to prioritize and which to deprioritize.
Strategic insights also inform territory planning, compensation design, and product roadmap decisions. Sales data becomes a strategic asset when ai makes it accessible.
Continuous Pipeline Optimization
Pipelines are never static. Market conditions change. Competition evolves. Customer needs shift.
Ai assistants support continuous optimization by tracking performance over time and highlighting what works. They test assumptions about ideal customer profiles, messaging, and timing.
This iterative approach keeps revenue teams adapting rather than relying on outdated playbooks. The ai learns from outcomes and refines recommendations, creating a feedback loop that improves results quarter over quarter.
How Gain.io Helps Revenue Teams Improve Pipeline Efficiency
Gain.io is a sales CRM built for revenue teams that need visibility into their pipeline and clarity on every deal. It brings contact management, visual sales pipelines, and task management together in one platform designed for sales workflows, helping teams close deals faster with Gain.io by standardizing stages and automating follow ups.
Sales reps use Gain.io to track opportunities from lead to close without switching between scattered tools. Notes capture sales conversations and deal insights. Email integration supports outreach and follow ups directly within the platform. Calendar features keep product demos, meetings, and follow ups organized.
For sales managers, Gain.io provides the pipeline visibility needed to coach reps and forecast accurately. Teams see deal progress, identify stalled opportunities, and prioritize high value activities without manual data entry or guesswork.
What Signals Help Identify High Value Opportunities In A Sales Pipeline
High value opportunities show consistent engagement, involvement of multiple stakeholders, and alignment with your ideal customer profile. Buyer signals like pricing questions, requests for product demos, and fast response times indicate readiness to move forward. Product usage data for trial accounts adds another layer, revealing which prospects experience value before they buy.
How AI Sales Assistants Support Revenue Forecasting
Ai sales assistants analyze historical deal patterns, current engagement levels, and pipeline stage duration to generate forecasts. They weight opportunities based on data rather than rep confidence alone. This approach reduces surprises and gives sales leaders more reliable numbers for planning.
Why Product Data Matters In Sales Pipeline Analysis
Product data shows how prospects interact with your solution beyond sales conversations. High engagement indicates value realization and buying intent. Low engagement signals risk. Incorporating product signals into pipeline analysis helps teams prioritize correctly and intervene early when deals show warning signs.
How Revenue Teams Detect Pipeline Risks Early
Ai assistants monitor engagement patterns, response times, and deal velocity to flag risks before they become losses. They alert reps when champions go quiet or when deals stall beyond normal cycle times. Early detection gives teams time to re-engage and save opportunities.
What Role Product Intelligence Plays In Sales Efficiency
Product intelligence helps sales reps personalize conversations based on how prospects use the solution. It identifies expansion opportunities within existing accounts and supports renewal forecasting. Teams using product intelligence spend time on the right opportunities rather than guessing where to focus.
Sales KPIs can feel overwhelming at first. How many sales KPIs should a sales team really track? Modern sales teams often collect endless sales data but still miss revenue targets. More numbers do not mean better sales performance.
The right sales KPIs bring focus. Sales leaders and sales managers rely on key performance indicators KPIs to track progress across the sales pipeline. Metrics like customer acquisition cost CAC, customer lifetime value CLV, conversion rate, and average sales cycle length show what is working inside the sales process. Monthly sales growth, monthly recurring revenue, and closed deals reveal the real story behind sales revenue.
In this article, we will discuss clear KPIs for sales improve sales team performance, guide sales strategy, and drive consistent revenue growth across the entire sales team.
What Are Sales KPIs
Sales KPIs turn sales data into a clear direction. Key performance indicators KPIs show how sales performance connects to sales goals and revenue targets. Sales leaders and sales managers use sales KPIs to track progress across the sales process, sales pipeline, and sales funnel. Metrics like conversion rate, customer acquisition cost CAC, and customer lifetime value CLV reveal if sales efforts drive real revenue growth.
Sales metrics measure activity. Sales KPIs measure impact. Number of leads, number of deals, and sales activities are data points. Critical sales KPIs link those numbers to sales revenue, monthly sales growth, and total revenue. Modern sales teams rely on tracking sales KPIs to improve sales team performance, strengthen customer retention, and support consistent revenue growth across sales organizations.
How To Choose The Right Sales Performance Indicators
Choosing the right sales performance indicators starts with understanding what you want to achieve. Sales leaders who select sales KPIs without connecting them to business objectives end up tracking data that doesn't improve sales team performance or drive revenue growth.
Arrange KPIs With Your Revenue Goals
Your business objectives define which key performance indicators for sales matter most. Start by identifying your main goal. Are you focused on expanding market share, improving profitability with current resources, or accelerating customer acquisition? You can select relevant sales KPIs that track progress toward these outcomes once you establish this direction.
Work backward from your revenue operation targets to identify what needs to happen. Your monthly sales target becomes 100 sales if your annual revenue goal is 1,200 sales. Break this down further. How many deals must your sales team close monthly to hit that number? How many sales opportunities do you need in your sales pipeline to generate those closed deals? How many meetings with prospects does your entire sales team need each week to create those opportunities?
Select Measurable And Actionable Metrics
Not all sales metrics qualify as effective key performance indicators kpis. Your sales kpis to track must follow the SMART framework: Specific, Measurable, Achievable, Relevant and Time-bound.
Specific means you define metrics free from ambiguity. Rather than tracking "improve sales," define "increase monthly sales revenue by 15% in Q2 2026". Measurable requires quantifiable data you can collect with consistency. Achievable ensures your sales targets remain realistic given your resources and market conditions. Relevant metrics directly tie to your strategic goals. Time-bound indicators include defined evaluation periods.
Prioritize KPIs That Drive Decisions
Focus on five to seven metrics that reflect business health and guide decision-making with clarity. Spotting patterns and acting with the clarity your sales team needs becomes harder when everything feels urgent.
Each KPI should tell you what to do next if you're not meeting your goal. You should assess secondary metrics associated with that goal if you haven't hit your monthly sales bookings target. Check your lead to meeting conversion rate, average sales cycle length, or sales target attainment. You have an easier time getting to the root cause when you have metrics tied to each primary KPI that are defined with clarity.
Essential Sales KPIs Examples For Revenue Growth
Revenue growth depends on tracking the right financial and performance metrics. The following sales kpis examples provide clear visibility into your sales team performance and help sales leaders make analytical decisions about resource allocation and sales strategy.
Monthly Sales Growth And Bookings
Monthly sales growth measures how your sales revenue increases or decreases over a one-month period. You calculate it by subtracting sales from the previous month from current month sales, dividing by prior month sales, and multiplying by 100. To cite an instance, your monthly sales growth is 20% if you generated $120,000 this month compared to $100,000 last month.
Sales managers can uncover problems and remedy them fast with this metric. You can act right away when a dip occurs rather than waiting for quarterly reviews. Monthly sales growth also motivates your entire sales team by giving them goals to work toward in four-week sprints.
Average Profit Margin
Average profit margin measures your business's efficiency in converting sales into revenue. It represents the percentage of revenue that remains as company profit after accounting for all expenses and production costs. You calculate it by dividing net profit by total revenue and multiplying by 100.
Divide $50,000 by $500,000 to get 0.1, then multiply by 100 for a 10% average profit margin if your net profit minus costs of goods is $50,000 and total revenue is $500,000. A high profit margin of 10% or higher shows you generate profit from sales and operate well. A low profit margin below 5% may signal struggles with profitability due to high costs, low pricing, or operational inefficiencies.
Sales Target Attainment
Sales target attainment shows how individual sales reps, sales teams, or sales organizations performed against their quota for a set time period. You express it as a percentage by dividing actual sales by target sales and multiplying by 100. Their quota attainment for that quarter was 75% if a sales rep's quarterly quota was $100,000 and they generated $75,000.
Only 24.3% of salespeople exceed their yearly quota. 50% quota attainment is the norm in the SaaS industry, not 100% as many assume. Your sales team's consistency in reaching monthly, quarterly, or annual sales quotas relates to overall revenue performance and growth profile.
Quote To Close Ratio
Quote to close ratio compares the number of closed deals to quotes sent out. You calculate it by dividing closed and won deals by number of quotes and multiplying by 100. Their quote-to-close ratio is 20% if your sales rep achieved 30 closed deals out of 150 quotes.
This metric assesses your sales reps' effectiveness by comparing it to historical trends or current targets. A ratio of 20% to 30% is average in many industries, while a ratio above 30% may be seen as above average. The biotech industry has an average close ratio of 15%, software is 22%, and finance is 19%.
Key Performance Indicators For Sales Pipeline Health
Pipeline health determines whether your sales team can hit revenue targets consistently. These key performance indicators for sales reveal bottlenecks, forecast accuracy, and the speed at which opportunities convert into actual sales.
Pipeline Coverage And Velocity
Pipeline coverage compares the total dollar value of your sales opportunities against revenue targets. Calculate it by dividing total pipeline value by your sales target. Your coverage ratio is 2.5 if your quarterly target is $100,000 and your pipeline holds $250,000.
Enterprise sales teams maintain 3-5x coverage to account for longer sales cycles and multiple stakeholders. Mid-market B2B teams target 2.5-4x coverage, while high-velocity SMB sales operate with 2-3x coverage. Your historical win rate heavily influences your ideal ratio. You need at least 4x coverage just to break even if your team closes 25% of qualified opportunities.
Lead To Meeting Conversion Rate
Lead to meeting conversion rate tracks the percentage of qualified leads that convert to booked meetings. The median qualified-to-booked rate across high-performing B2B SaaS companies reaches 62%, while top quartile performers hit 72%. The best companies reach 88%.
Many teams still operate with sales processes and assume 35-40% represents solid performance. This reflects outdated manual scheduling and delayed responses. You should expect substantially higher conversion rates with modern infrastructure. Time-to-meeting should be tracked alongside conversion rate. A 60% conversion means little if the average time from form fill to booked meeting stretches to five days.
Average Sales Cycle Length
Average sales cycle length measures the time from your first touch with a prospect to closing the deal, averaged across all won deals. Calculate it by adding the number of days from first contact to customer conversion for all deals, then divide by the number of deals.
B2B companies average 102 days for the complete sales cycle. This breaks down to 84 days from lead to opportunity and 18 days from opportunity to close. Your actual cycle varies based on product complexity, customer size, number of decision-makers, and price point.
Deal Win Rate And Slippage
Win rate represents the percentage of deals won out of the total number of deals pursued. Calculate it by dividing closed-won deals by all opportunities created during the same timeframe. B2B sales teams benchmark at 6% win rate.
A higher win rate indicates your sales team closes deals more efficiently. This results in faster pipeline movement and higher velocity. Win rates serve as a fundamental indicator of sales team health. Top-performing sales organizations maintain win rates approximately 50% higher than their peers.
Customer Focused Sales KPIs For Long Term Success
Long-term success extends beyond closing deals. Customer-focused sales KPIs measure the value existing customers bring and predict future revenue stability.
Customer Lifetime Value
Customer lifetime value clv measures total revenue you expect from a single customer throughout your relationship. Calculate it by multiplying average purchase value by the purchase frequency and customer lifespan. For SaaS businesses, divide monthly average revenue per account by churn rate.
A healthy LTV: CAC ratio is 3:1 or higher. Your customer lifetime value should be at least three times your customer acquisition cost cac to cover operating costs and maintain profitability. Research shows that a 5% increase in customer retention increases profits anywhere from 25% to 95%. Retaining existing customers costs 5 to 25 times less than acquiring new ones.
Customer Retention And Churn Rate
Customer retention rate tracks the percentage of existing customers who remain after a given period. Churn rate measures the percentage who leave. Calculate churn by dividing customers lost by customers at the start of the period and multiplying by 100.
Top-performing B2B SaaS companies achieve 10% to 30% lower customer churn than average performers. Subscription businesses want annual churn below 5% to 7%.
Net Promoter Score
Net promoter score measures customer loyalty by asking how likely customers are to recommend your business on a scale of 0 to 10. Over 70% of Fortune 500 companies use this metric. Promoters score 9 to 10 while detractors score 0 to 6. Calculate NPS by subtracting the percentage of detractors from the percentage of promoters.
A 10-point increase in NPS is associated with a 3.2% increase in upsale revenue. A 7% increase in NPS equates to a 1% increase in total revenue.
How To Track And Visualize Your Sales KPIs
Sales KPIs only matter when teams track them with discipline. Clear dashboards help sales leaders see trends fast. Strong sales visibility into sales data improves sales performance, supports better decisions, and keeps revenue targets within reach.
Define The Right Sales KPIs First
Start with the right sales KPIs. Not every metric deserves attention. Sales activity metrics like number of leads or emails sent are useful. Critical sales KPIs connect directly to sales revenue and revenue growth.
Focus on conversion rate, customer acquisition cost CAC, customer lifetime value CLV, and average sales cycle length. Gartner reports that organizations that align KPIs with lead generation strategy are 2.3 times more likely to outperform competitors. Clear key performance indicators KPIs improve sales team performance and guide the entire sales team toward shared sales goals.
Align KPIs With Revenue Targets
Sales KPIs should support revenue targets. Every KPI must answer one question. Does this help hit revenue targets?
Link monthly sales growth, monthly recurring revenue, and closed deals to annual revenue goals. HubSpot data shows that companies with defined sales goals achieve 10 percent higher sales target attainment. Sales managers and sales leaders need direct visibility into sales pipeline health to track progress toward total revenue and consistent revenue growth.
Use CRM For Real-Time Visibility
Customer relationship management systems centralize sales data. Modern sales teams rely on CRM dashboards to monitor sales pipeline, sales opportunities, and customers acquired.
Salesforce research shows that high-performing sales organizations are 1.5 times more likely to use data-driven sales analytics. CRM tools track sales cycle length, average sales cycle, and average revenue per deal. Real-time access improves sales effectiveness and supports smarter sales strategy decisions.
Build Clear Sales Dashboards
Dashboards make complex data simple. Sales KPIs to track should appear in one clean view. Avoid clutter.
Show total revenue, monthly sales bookings, conversion rate, and number of deals. Include customer acquisition cost and customer lifetime value. McKinsey reports that companies using advanced analytics see up to 15 percent higher sales productivity. Clear visuals help sales reps and sales managers focus on important sales KPIs without distraction.
Track Individual And Team Performance
Sales KPIs differ across roles. Sales reps focus on sales activities, closed deals, and sales cycle performance. Sales managers focus on team performance and sales target attainment.
Transparent data improves accountability. Harvard Business Review found that clear performance measurement can improve productivity by 12 percent. Tracking sales KPIs across individual and team performance ensures alignment between daily sales efforts and long-term revenue growth.
Monitor monthly sales growth, recurring revenue, and average profit margin. Evaluate customer retention and net promoter score alongside sales revenue. Consistent review cycles help sales organizations adjust strategy before problems grow. Strong review habits keep sales operations proactive and focused on critical sales KPIs.
How Gain.io Helps You Track And Optimize Sales KPIs
Gain.io brings clarity to your sales KPIs in one unified view. Sales leaders no longer chase scattered sales data across tools. Gain.io has several key features. The platform connects sales pipeline, customer acquisition cost CAC, customer lifetime value CLV, and monthly recurring revenue into one actionable dashboard.
Modern sales teams need more than static reports. Gain.io supports real-time sales analytics, sales performance tracking, and sales revenue forecasting. Sales managers can monitor sales cycle length, conversion rate, monthly sales growth, and closed deals without manual effort. Clear visibility into critical sales KPIs improves sales productivity and sales target attainment.
Aligned sales strategy and sales operations become easier when the entire sales team works from the same data. Gain.io helps sales organizations turn key performance indicators KPIs into measurable revenue growth and consistent revenue results.
FAQs
How Many Sales KPIs Should A Small Sales Team Track?
Yes, most small sales teams should track only 5 to 7 critical sales KPIs. Focus on conversion rate, customer acquisition cost CAC, customer lifetime value CLV, monthly sales growth, and sales target attainment. Clear sales metrics improve sales performance without overwhelming the entire sales team.
Can Sales KPIs Improve Forecast Accuracy For Revenue Growth?
Yes, sales KPIs strengthen forecast accuracy when tied to real sales data. Metrics like sales pipeline coverage, average sales cycle length, and win rate help sales leaders predict total revenue. Strong sales analytics reduce guesswork and improve revenue targets planning.
Do Sales KPIs Differ Between B2B And B2C Sales Organizations?
Yes, sales KPIs differ based on sales strategy and sales cycle. B2B sales organizations focus more on pipeline health, customer lifetime value, and longer sales cycle length. B2C teams prioritize conversion rate, number of deals, and customer acquisition at scale.
Is Customer Lifetime Value More Important Than Customer Acquisition Cost?
No, both customer lifetime value CLV and customer acquisition cost CAC matter equally. Healthy sales performance depends on a strong LTV to CAC ratio. Sales leaders often aim for at least 3:1 to ensure sustainable revenue growth and recurring revenue stability.
Which Sales KPIs Help Identify Weak Sales Team Performance Early?
Sales target attainment, lead to opportunity conversion rate, and sales productivity often reveal early performance gaps. Low win rate or extended average sales cycle signals issues inside the sales process. Early tracking helps sales managers adjust sales efforts before revenue suffers.
Revenue operations has become the operating system for modern B2B growth. If your marketing generates leads that sales cannot close, or if closed deals churn before customer success teams can retain them, you are leaving money on the table.
The problem is not effort. Your teams work hard. The problem is disconnection. Marketing optimizes for one set of numbers. Sales chases another. Customer success measures something entirely different. Nobody shares the same page.
Revenue operations solves this by creating one plan, one dataset, and one process that spans the revenue cycle. This guide breaks down what RevOps looks like in 2025, why it matters for your bottom line, and how to build a function that drives revenue growth at every stage of the customer lifecycle.
What Revenue Operations Is In 2025
Revenue operations revops functions as a cross functional operating system that connects marketing, sales, customer success, and finance around shared revenue outcomes. It is not a rebrand of sales ops. It is a fundamentally different approach to how companies generate and retain revenue.
Here is how RevOps differs from traditional models:
Traditional silos: Marketing optimizes qualified leads, sales handles deals, and customer success teams manage renewals without a common plan or dataset
RevOps model: All three functions operate from unified revenue targets, shared definitions, and integrated processes across the entire revenue journey
Scope: Revenue operations spans the full customer lifecycle, from first website visit through expansion and renewal
Outcome focus: Instead of departmental metrics, RevOps prioritizes business growth indicators like net revenue retention and customer lifetime value
Industry research suggests that the majority of high growth B2B companies will adopt some form of RevOps by 2026. The shift is driven by subscription economics, longer buying committees, and the sheer complexity of modern customer journeys.
Consider a B2B SaaS company running demand generation, sales execution, onboarding, and renewals from one integrated RevOps playbook. Marketing knows exactly what makes a sales accepted lead. Sales understands which customer behaviors predict long term retention. Customer success has visibility into the promises made during the sales process. Everyone works from the same customer data.
That is what RevOps looks like when it works.
Why Revenue Operations Matters For Modern Go To Market Teams
The 2024 and 2025 buying environment creates friction everywhere. Buyers research independently before talking to sales reps. Buying committees have expanded to include more stakeholders. Subscription models mean customer acquisition is just the beginning of the revenue relationship.
When teams are not aligned, this friction multiplies. Here are the specific business problems RevOps solves:
Leads stalling between marketing and sales because of poor lead management and unclear handoff criteria
Inaccurate revenue forecasts that embarrass leadership in board meetings and derail hiring plans
Disjointed onboarding experiences where customer success inherits deals without context
Unexpected churn at renewal because nobody tracked engagement signals across the customer journey
Conflicting metrics where each team claims success while overall revenue targets get missed
RevOps creates a single view of the customer from first touch through renewal. This visibility helps business leaders make faster decisions with better data.
Clear visibility into revenue pipeline health by stage
Win rate
Better sales process consistency and enablement
Sales cycle time
Faster handoffs and reduced friction
Net revenue retention
Proactive churn prevention and expansion motions
Customer acquisition cost
More efficient spend across the funnel
When revenue generating teams share the same operational metrics, they stop optimizing for their piece and start optimizing for the whole. That is how companies achieve sustainable growth instead of quarter over quarter firefighting.
How Revenue Operations Aligns Marketing Sales And Customer Success
Follow a typical B2B SaaS buyer from first ad click to second year renewal. At every key handoff, RevOps owns the process.
A prospect clicks a paid ad and downloads a whitepaper. Marketing captures the lead, scores it based on firmographic and behavioral signals, and routes it to sales when it hits the threshold. That threshold definition came from RevOps. So did the scoring model. So did the routing logic.
Sales accepts the lead, qualifies it through discovery, and moves it through the sales pipeline. RevOps defined the stage criteria. RevOps built the forecasting methodology. RevOps tracks sales cycle time and conversion rates to identify where deals get stuck.
The deal closes. Customer success takes over. But they are not starting blind. RevOps ensures the handoff includes key account context, success criteria discussed during sales, and timeline expectations. Customer success runs the onboarding playbook that RevOps standardized.
Here is how RevOps shapes each function:
Marketing Operations: Marketing operations focus on lead generation, campaign execution, and demand analytics. Under RevOps, marketing goals tie directly to revenue outcomes. Marketing is measured not just on lead volume, but on the quality of qualified leads that convert through the funnel.
Sales Operations: Sales operations focuses on territory design, compensation plans, and sales enablement. RevOps connects these activities to upstream and downstream functions. Sales ops ensures that sales efforts align with what marketing promises and what customer success can deliver.
Customer Success Ops: Customer success ops tracks health scores, renewal forecasts, and expansion opportunities. RevOps links this to the entire revenue team by sharing customer behavior insights with marketing for upsell campaigns and with sales for account expansion plays.
Specific alignment examples include:
A common definition of a marketing qualified lead that sales agrees is worth their time
Shared account scoring models that weight firmographic fit, engagement signals, and product usage
Joint playbooks for expansion and cross sell that customer service teams and sales reps execute together
Standardized service level agreements for response times on inbound demo requests
Clear timelines for passing closed won deals to onboarding
This alignment eliminates the finger pointing that kills revenue teams. Marketing cannot blame sales for not following up. Sales cannot blame success for churning deals. Everyone owns the entire revenue process together.
Core Components Of A Revenue Operations Function
RevOps teams handle four key functions that connect strategy to execution. Even small companies might combine these areas into one or two roles. Larger organizations may separate them into dedicated specialists.
Think in terms of capabilities rather than job titles. Here is what each component covers:
Strategy and planning: Annual targets, capacity models, and scenario testing
Data and analytics: Single source of truth, dashboards, and insight generation
Process design: Workflow mapping, handoffs, and playbook documentation
Systems and tooling: Tech stack integration, automation, and data flows
The following sections detail how each capability works in practice.
Strategy And Planning
RevOps partners with revenue leadership and finance to build annual and quarterly plans. This includes revenue targets, pipeline coverage requirements, and hiring capacity models.
A revenue operations manager tests scenarios before they go live. Considering new pricing? RevOps models the impact on average revenue per customer and sales cycle time. Entering a new market segment? RevOps analyzes historical data to set realistic conversion expectations.
Here is a 2025 planning cycle example. A scaling SaaS company needs to set sales quotas. RevOps pulls data on:
Historical ramp time for new sales reps
Territory potential based on total addressable market
Current conversion rates by segment and region
Average deal size trends over the past six quarters
Using this data, RevOps recommends quotas that push performance without setting the team up for failure. The chief revenue officer gets accurate forecasts. Finance gets reliable bookings projections. Sales gets achievable targets.
This positions RevOps as a strategic partner, not just a reporting function. The best RevOps teams spend more time on proactive planning than reactive fixes.
Data And Analytics
RevOps owns the single source of truth for revenue. This includes CRM data, marketing automation signals, product usage metrics, and customer health indicators.
Key dashboards a RevOps team typically manages include:
Dashboard
What It Tracks
Pipeline health
Stage distribution, velocity, and coverage ratios
Cohort retention
Churn and expansion patterns by customer segment
Average contract value
Deal size trends by segment and product
Forecast accuracy
Predicted versus actual outcomes over time
Funnel conversion
Drop off rates between lifecycle stages
Data quality practices matter here. RevOps defines clear field definitions so everyone means the same thing by “closed won” or “expansion opportunity.” Regular hygiene routines catch duplicates and outdated records. Alignment with finance ensures what counts as a booking in the CRM matches what hits the P&L.
Consider how RevOps uses data to identify trends. Product usage data shows certain accounts logging in less frequently. Support ticket data shows those same accounts filing complaints about a specific feature. RevOps connects these signals to flag churn risk accounts before renewal conversations begin.
That is leveraging data for data driven decision making.
Process Design And Optimization
RevOps maps the full revenue journey from first touch to renewal. Every handoff gets an owner, expected timeline, and service level agreement.
Process improvements RevOps commonly implements include:
Lead routing logic: Standardized rules that assign leads to the right sales reps based on territory, segment, or round robin
Post sale handoff: Structured checklist ensuring customer success receives account context, success criteria, and timeline expectations
Renewal playbooks: Trigger based workflows that start renewal conversations 90 days out with relevant health data
Expansion motions: Coordinated plays where customer success identifies opportunity and sales executes the upsell
Documentation matters. RevOps maintains playbooks that new hires can follow. Process reviews happen quarterly to catch new bottlenecks as the business scales.
Process design balances consistency with flexibility. Enterprise accounts need different treatment than mid market accounts. RevOps builds frameworks that accommodate these differences without creating chaos.
Systems And Tooling
RevOps coordinates the revenue technology stack. Typical elements include:
CRM as the system of record for customer data and pipeline
Marketing automation for campaign execution and lead scoring
Sales engagement platforms for outreach sequences and activity tracking
Data warehouses for unified reporting across sources
RevOps evaluates new tools based on three criteria:
Feature fit: Does it solve a real workflow problem?
Integration quality: Will it connect cleanly with existing systems?
Maintenance cost: What ongoing effort does it require?
Consolidating tools reduces duplicate data and manual spreadsheet work. If marketing uses one system to track leads, sales uses another to track deals, and success uses a third to track accounts, nobody has a complete picture.
RevOps also partners with IT and security to meet compliance and privacy standards. Global customers may require specific data residency. Regulated industries need audit trails. RevOps ensures the tech stack supports these requirements without slowing down sales teams.
Key Revenue Operations Roles And Team Structures
Team structure varies by company size and go to market complexity. Early stage companies might have a single Head of Revenue Operations or RevOps Manager. Larger companies may have directors or leads for systems, analytics, and enablement.
The roles described below represent common patterns across mature RevOps organizations. The exact structure depends on your stage, segment, and revenue model.
Head Of Revenue Operations
The Head of Revenue Operations owns overall RevOps strategy. Depending on company structure, this role reports to the chief revenue officer, COO, or CEO.
Key responsibilities include:
Aligning go to market plans across marketing, sales, and customer success
Sponsoring major systems changes and consolidation efforts
Ensuring revenue data matches what finance reports to the board
Translating operational insights into executive level recommendations
Building and developing the RevOps team
Consider a scaling SaaS company transitioning from region based to segment based territories. The Head of RevOps leads this initiative. They model the impact on quota distribution, coordinate CRM changes with systems, and communicate the transition to sales leadership.
This role requires strong communication skills, executive presence, and the ability to translate complex data into clear revenue decisions.
Revenue Operations Manager Or Lead
The revenue operations manager handles day to day RevOps execution. This includes dashboard maintenance, process rollouts, and operational support for revenue teams.
A RevOps Manager acts as internal consultant. Marketing asks why lead quality dropped this quarter. The RevOps Manager runs the analysis, identifies a targeting change that introduced lower fit accounts, and recommends adjustments.
Key skills for this role:
Strong CRM knowledge and system administration ability
Analytical capability to run funnel analyses and cohort studies
Stakeholder management across marketing, sales, and customer success
Process documentation and change management
Comfort with both strategic thinking and hands on execution
In smaller organizations, this person may be both strategist and hands on builder of workflows, reports, and automations.
Systems And Integrations Lead
The Systems Lead owns revenue tech stack architecture. They select systems, design integrations, and maintain data flows between platforms.
A typical project might involve consolidating multiple point tools into a single engagement platform. The Systems Lead scopes requirements, evaluates vendors, manages implementation, and ensures the migration does not disrupt live revenue streams.
This role works closely with IT, security, and data teams. They ensure the stack meets performance requirements, scales with growth, and complies with privacy regulations.
Even when the title varies, the responsibility for technical foundations is critical. Poor system architecture creates the data silos that RevOps exists to eliminate.
Revenue Analyst Or Business Intelligence Partner
The Revenue Analyst turns raw data into actionable insights. They use SQL, BI dashboards, and statistical models to answer questions from revenue leadership.
Example analyses include:
Pipeline conversion rates by segment, comparing enterprise versus mid market performance
Pricing impact studies that measure how discount levels affect win rate
Cohort based retention analysis showing which customer segments retain best
Sales productivity metrics comparing ramped versus new rep performance
This role collaborates closely with finance to reconcile bookings, revenue recognition, and forecasting methodologies. When sales says they closed a deal and finance says it does not count yet, the Revenue Analyst helps clarify definitions and timing.
These insights influence real decisions. Hiring plans depend on productivity data. Marketing spend shifts based on channel conversion. Customer success coverage models adjust based on retention patterns.
Revenue Operations Metrics
RevOps success is measured with a focused set of metrics that span the customer lifecycle. These are not vanity numbers. They connect directly to revenue goals and board level expectations.
RevOps should help leadership pick a small, stable core of metrics instead of chasing every possible measurement. Here are the categories that matter:
Acquisition Metrics
Acquisition metrics track efficiency of bringing new customers into the revenue pipeline.
Customer acquisition cost: Total marketing and sales spend divided by new customers acquired. Reveals whether growth spending is efficient.
Lead to opportunity conversion rate: Percentage of marketing qualified leads that become sales accepted opportunities. Identifies qualification issues.
Pipeline source mix: Breakdown of revenue pipeline by marketing sourced versus sales sourced. Shows where opportunities originate.
RevOps uses these metrics to balance growth with efficient spending. If a specific channel produces high lead volume but low conversion, RevOps recommends reallocation.
Consider tightening qualification criteria. Fewer leads enter the funnel, but those that do convert at higher rates. Customer acquisition cost drops even though lead volume fell.
Sales Performance And Efficiency Metrics
These metrics track how well sales teams convert opportunity into revenue.
Metric
What It Measures
Win rate
Percentage of opportunities that close won
Average deal size
Average revenue per closed opportunity
Sales cycle time
Days from opportunity creation to close
Quota attainment
Percentage of sales reps hitting their targets
Forecast accuracy
How close predictions match actual outcomes
RevOps monitors these across segments, regions, and product lines. If enterprise win rates drop while mid market holds steady, RevOps investigates whether the sales process needs adjustment for larger deals.
Historical data from three to six previous quarters builds more accurate forecasts. RevOps uses these patterns to set realistic expectations and identify when performance deviates from trends.
Retention And Expansion Metrics
These metrics track revenue from existing customers. In recurring revenue businesses, retention often matters more than new customer acquisition.
Net revenue retention: Revenue from existing customers including expansion, minus churn, divided by starting revenue. Above 100 percent means customer base is growing.
Gross revenue retention: Same calculation without expansion revenue. Shows pure churn impact.
Customer churn rate: Percentage of customers that leave during a period.
Expansion revenue: Additional revenue from upsells, cross sells, and upgrades.
RevOps helps customer success and account management build proactive playbooks. Renewal timelines trigger outreach 90 days early. Product usage drops trigger health check conversations.
Here is why retention matters so much. A company with 90 percent net revenue retention loses 10 percent of revenue from existing customers each year. A company with 110 percent retention gains 10 percent. Over five years, that difference compounds dramatically.
Small consistent improvements in customer retention create more long term revenue impact than equivalent improvements in new logo acquisition.
Steps To Implement Revenue Operations In Your Organization
Moving to a RevOps model is a staged journey. It does not happen in a single meeting or reorg announcement. The sequence below provides a realistic path from current state to operational maturity.
Assess Current Revenue Processes And Data
Start by mapping your current customer journey. List every system, handoff, and owner involved in moving from lead to renewal.
Run stakeholder interviews with marketing, sales, customer success, and finance. Ask questions like:
Where do leads get stuck between teams?
What definitions cause confusion or disputes?
Which reports do you trust? Which do you not trust?
What manual work could be automated?
Simple diagnostics reveal quick wins:
Does CRM data match invoices? Compare closed won records to finance bookings.
How many leads lack a clear owner? Query for leads with no assigned rep.
Are handoff criteria documented? Ask teams to describe them without looking at documentation.
This assessment creates the baseline for improvement. You can start this work within a week.
Align Around Shared Goals And Definitions
Leadership defines a common set of goals. These typically include:
Pipeline coverage ratios by segment
New annual recurring revenue targets by quarter
Net revenue retention by customer cohort
Average revenue per account growth
Cascade these goals to each team with clear ownership. Marketing owns pipeline generation targets. Sales owns conversion and bookings. Customer success owns retention and expansion.
Define shared terms in writing:
Term
Definition
Marketing qualified lead
Lead with score above 50 based on firmographic fit and engagement
Sales accepted lead
MQL that sales has reviewed and agreed to work
Qualified opportunity
Discovery completed, budget confirmed, decision timeline established
At risk renewal
Account with health score below 60 within 90 days of renewal
Standardize forecasting practices. Sales, finance, and customer success should all reference the same numbers when discussing expected revenue.
Build Or Evolve The RevOps Team And Tech Stack
Smaller companies can start with one RevOps generalist who handles strategy, systems, and analytics. Larger companies may centralize previously separate marketing ops and sales ops teams under unified RevOps leadership.
For tech stack decisions, prioritize a clean integrated core:
CRM as the single source of truth for customer data
Monthly: Funnel conversion analysis and process improvement identification
Quarterly: Strategic review with leadership covering metrics, initiatives, and priorities
Change management matters. Document process updates so improvements stick. Train teams on new workflows. Communicate why changes happen, not just what changes.
Expect early wins within one to two quarters. Reporting clarity improves. Handoff quality increases. Teams spend less time arguing about data.
Deeper impact takes six to twelve months. Win rates improve as processes mature. Sales cycle time shrinks as friction reduces. Customer retention climbs as success teams get better signals earlier.
How Gain.io Accelerates Revenue Operations
Gain.io helps modern go-to-market organizations strengthen their revenue operations team by bringing sales, marketing, and customer functions into a single operational framework. Instead of working in silos, marketing and customer success teams can collaborate using shared data, aligned workflows, and consistent performance visibility. This unified strategy supports better revenue management by improving forecast accuracy, reducing friction across handoffs, and identifying gaps in the revenue lifecycle.
By centralizing insights, Gain.io enables teams to focus on optimizing sales processes, improving operational efficiency, and tracking customer behavior across the entire journey. The platform also supports smarter decision-making that drives sustainable revenue growth while helping leaders maximize revenue through clearer pipeline visibility, stronger alignment, and better revenue generation planning across every stage of the go-to-market process.
FAQs
What Does A Revenue Operations Team Actually Do?
A revenue operations team aligns sales marketing and customer departments under one operational structure. Its primary goal is to improve coordination, eliminate data silos, and ensure teams work toward unified revenue goals. By managing processes, tools, and analytics, the team supports consistent revenue generation and predictable growth outcomes.
Why Is Revenue Ops Important For Go To Market Teams?
Revenue ops creates a unified strategy that connects marketing and customer success workflows with sales execution. This alignment improves customer satisfaction, reduces process inefficiencies, and helps organizations track the full revenue lifecycle from acquisition through retention and expansion.
How Does Revenue Operations Support Sustainable Growth?
Revenue operations focuses on building repeatable processes that improve operational efficiency and forecasting accuracy. By analyzing performance data across teams, it helps organizations achieve sustainable revenue growth while maintaining clear visibility into revenue streams and long-term customer value.
What Metrics Are Managed Within Revenue Management?
Revenue management typically tracks pipeline performance, customer retention, conversion rates, and forecast accuracy. These insights help leaders identify trends, optimize resource allocation, and maximize revenue through better planning across the entire revenue journey.
How Does Revenue Operations Improve Customer Experience?
By aligning sales marketing and customer success workflows, revenue operations ensures smoother handoffs and consistent communication. This coordination helps improve customer satisfaction, strengthens retention efforts, and supports a more predictable revenue lifecycle across the entire organization.
Your sales conversion rate measures how effectively your sales team turns qualified leads and potential customers into paying customers. As an important metric, conversion rate measures the percentage of prospects who take the desired action, from the interest stage to the final purchase. A higher sales conversion rate signals stronger sales performance, better lead quality, and more efficient sales and marketing efforts across the entire sales funnel.
Yet many B2B sales leaders struggle with inconsistent conversion performance at each sales stage. Multiple factors such as deal complexity, lead source, sales pitch quality, and buyer journey friction influence funnel performance. Using sales analytics software, CRM data, and clear industry benchmarks, sales managers can identify areas for higher conversion rates and lower customer acquisition cost. In the following formula and example, you will learn how to calculate sales conversion, evaluate average conversion rate by industry standards, and improve win rate, total revenue, and overall sales efforts.
What Is Sales Conversion Rate
A sales conversion rate measures the percentage of potential customers who take a desired action after a sales pitch. That action could be a demo request, a meeting, or a final purchase. Conversion rates show how well your sales team turns qualified leads into paying customers. As an important metric, the conversion rate measures performance across each sales stage of the buyer journey.
Sales leaders track sales conversion to evaluate sales performance and lead quality. Sales managers rely on sales analytics software and CRM data to review funnel performance and identify areas that cause lower conversion rates. Strong sales and marketing efforts, relevant content, and targeted advertising improve higher conversion rates.
A good sales conversion rate depends on industry benchmarks, deal complexity, and lead source. Higher conversion means more new customers, better win rate, lower customer acquisition cost, and stronger total revenue across the sales funnel.
How To Calculate Sales Conversion Rate
Calculating your sales conversion rate requires a straightforward formula and attention to where you measure it in your sales funnel. The math itself is simple. The challenge lies in applying it correctly to different funnel stages and avoiding common errors that skew your sales data.
The Simple Sales Conversion Rate Formula
The standard formula divides the number of conversions by the total number of leads, then multiplies by 100 to get a percentage. You take your total number of closed deals and divide that by your total qualified leads, then multiply by 100.
Here's what that looks like in practice. Your sales conversion rate sits at 27% if you had 100 leads and closed 27 deals. Another example: 32 qualified leads that resulted in 20 sales would give you a conversion rate of 62.5%.
The following formula applies in most sales scenarios: Number of Sales ÷ Number of Leads × 100. Your number of sales represents the total count of deals closed, not the dollar amount. Your number of leads has prospects who asked about or interacted with your company.
The calculation stays consistent for B2B teams tracking website conversions. Your eCommerce business received 1,000 site visitors in one month and got 50 customer orders. The conversion would be 5.0% for the month. The conversion rate measures how many visitors complete a purchase compared to total website traffic.
Calculating Conversion Rates At Different Funnel Stages
Your sales team should track conversion performance at each stage of the buyer trip. The formula for sales funnel conversion rates stays consistent in all stages: number of contacts in the later stage divided by number of contacts in the earlier stage, multiplied by 100.
You can apply this calculation to any funnel transition. Lead to MQL shows how many raw leads qualify for marketing engagement. MQL to SQL reveals how marketing qualified leads convert to sales qualified leads. SQL to opportunity measures how many sales qualified leads turn into genuine pipeline opportunities. Opportunity to closed deal tracks your final win rate.
Many sales managers measure these components separately. The analysis often follows this structure: Total MQLs that reached SQL status divided by Total MQLs times 100 equals MQL to SQL conversion rate. Total opportunities divided by total sales qualified leads times 100 equals SQL to opportunity conversion rate. Total closed won divided by total opportunities times 100 equals close won conversion rate.
Let me show you a real calculation. Your conversion rate would be 57% if 350 opportunities reached "In Discussion" stage and 200 got to "Proposal" stage. This granular approach helps you identify specific bottlenecks where potential customers drop off.
You can also zoom out and calculate broader conversion rates, like lead to opportunity, to assess overall funnel performance and compare against past performance or industry standards.
Common Calculation Mistakes To Avoid
The most common mistake involves timing. Many sales teams calculate conversion by dividing number of sales during a period by number of new leads during that same period. This works fine if your sales cycle runs short, between 1 to 5 days. Businesses with longer cycles of 2+ weeks face a substantial problem with this method.
Here's why that breaks down. Each sales representative gets about 100 leads per month but one month they receive 150. Most of those deals will close next month since the sales cycle takes several weeks. So this month's conversion rate will appear to drop, even though sales performance hasn't declined.
The better approach uses cohort-based conversion: deals from a given cohort divided by total leads in that cohort. You count sales from a given lead cohort and only add payments from deals that originated in that month. This becomes a lagging metric, meaning you'll only know January's real performance by the time February ends.
Data inconsistencies can substantially skew your conversion rate calculations and create misleading performance insights. Common issues are duplicate records, incomplete pipeline stage updates, or inconsistent deal qualification criteria among team members. Conversion stalls before it even starts when sales and marketing teams use different criteria for qualification and lead handoff.
Sales managers should standardize what makes a lead "qualified" to ensure better alignment and more accurate sales forecasting method in go-to-market teams of all types. Friction during handoffs between SDRs, account executives, and customer success teams reduces when you use shared qualification fields in your CRM and sync expectations during onboarding.
How B2B Sales Funnel Conversion Works
B2B sales funnel conversion tracks how prospects move through distinct qualification stages. Each stage represents a specific milestone in the buyer trip. These transitions help sales and marketing teams identify where conversion performance breaks down and where qualified leads progress smoothly toward becoming paying customers.
Lead To MQL Conversion
Leads are contacts who just found your company through channels like content marketing, SEO, PPC, or social media. These prospects enter your sales funnel by sharing their contact information. Marketing qualified leads show signs of deeper engagement and are more likely to think about a purchase. The move from lead to MQL involves lead scoring and nurture campaigns. You use signals like content downloads, page views, and email interactions. Lead quality matters more than volume at this stage. The conversion rate measures how your marketing strategies attract the right audience and nurture them through initial qualification. Industry benchmarks for lead to MQL conversion sit between 25% and 35%. Average B2B funnels convert 31% of leads to MQLs.
MQL To SQL Conversion
Sales qualified leads meet criteria that sales and marketing teams agreed upon. Prospects have engaged with bottom-of-funnel content like demo requests and are ready for sales outreach at this point. This stage filters marketing engagement from genuine sales readiness. The biggest conversion loss occurs between MQL and SQL. Speed to lead still wins here. You make yourself 21 times more likely to qualify your lead when you respond within 5 minutes versus waiting 30 minutes. Organizations that respond within one hour achieve 53% conversion rates compared to 17% for responses after 24 hours. Average MQL to SQL conversion rates range from 13% to 26%. Most B2B funnels average 13%. Top-performing teams achieve between 25% and 35%.
SQL To Opportunity Conversion
An SQL becomes an opportunity when they've expressed clear buying intent. This happens following the discovery call and signals that the sales process is underway. Conversion at this stage hinges on social proof like testimonials and case studies. You also need to involve other decision-makers in the organization. SQL to opportunity represents the transition from sales-ready leads to genuine pipeline opportunities. A good conversion rate sits between 55% and 70%, though this can vary by industry and lead qualification process. Average B2B funnels show SQL to opportunity conversion between 50% and 62%, with baseline performance at 50%.
Opportunity To Closed Deal Conversion
The prospect either becomes a customer or doesn't at this stage. You're measuring sales performance metrics like win rate, average deal size, and contract value. Opportunity to close rates vary by industry, product offering, and deal complexity. Most B2B SaaS companies see conversion rates between 15% and 35%. Product-led growth companies with strong qualification signals achieve 40% to 50%. Complex enterprise sales with longer cycles might reach 15% to 25%. Average B2B funnel performance shows opportunity to close conversion between 15% and 30%. Most organizations average 25%.
Average B2B Sales Funnel Conversion Rates By Stage
Industry benchmarks provide context to plan pipeline. Lead to MQL conversion averages 31%. High performers reach 40% to 50%. MQL to SQL sits at 13% average, with top performers hitting 20% to 25%. SQL to opportunity averages 50%. High performers achieve 55% to 62%. Opportunity to customer averages 25%, with top performers reaching 30% to 40%. Most B2B funnels lose over 90% of leads before the opportunity stage. These benchmarks shift based on lead source. SEO-generated leads convert at higher rates than paid advertising prospects by a lot. Your sales funnel conversion rates help sales leaders set realistic revenue goals and identify areas that need improvement.
Key Factors Of Sales Conversion Rate
Sales conversion rate depends on more than a strong sales pitch. Multiple factors across the sales funnel influence conversion performance. Sales leaders must analyze lead quality, funnel friction, alignment, and buyer readiness. Small gaps at any sales stage can lower conversion rates and reduce total revenue.
Lead Quality And Scoring
Lead quality has a direct impact on sales conversion rate. Qualified leads move faster through the sales process and close at higher rates. When lead qualification process improves, customer acquisition cost drops and sales performance increases.
Data shows companies that use lead scoring see up to a 70% increase in lead generation ROI. The lead conversion rate from prospects to qualified leads often rises to 15–20%. Sales reps perform better when they focus on high quality leads instead of chasing volume. Besides, you need to reduce lead generation mistakes to improve sales conversion rate.
Sales Process Efficiency
Scalable sales process clarity supports higher conversion rates. Complex workflows create friction for potential buyers. Research shows 22% of customers abandon purchases due to long or complicated checkout steps. That's why you need to optimize your sales workflow.
Map each sales stage from first contact to final purchase. Identify areas where deals slow down. Faster response times and fewer approval layers improve win rate and overall funnel performance.
Sales And Marketing Alignment
Sales and marketing alignment drives measurable growth. Organizations with strong alignment report 70% higher conversion rates and more than 200% revenue growth.
Broken handoffs reduce pipeline impact. Research shows 53% of companies fail to follow up with over one-third of marketing-engaged prospects. Shared definitions of qualified leads and clear ownership at every sales stage improve higher conversion and customer retention by 36%.
Product Market Fit
Product market fit strengthens sales conversion. Buyers convert faster when your solution matches their pain points. Research shows 86% of B2B buyers are more likely to purchase when vendors understand their goals.
Clear value messaging improves average conversion rate across different industries. Strong fit reduces deal complexity and shortens the buying journey. Sales leaders should review customer feedback and CRM data to protect long-term funnel performance.
Speed To Lead Response
Response speed influences lead conversion rate. Studies show responding within five minutes makes sales reps 21 times more likely to qualify a lead compared to waiting 30 minutes.
Fast follow-up improves buyer trust during the interest stage. Sales dashboards help sales managers monitor response time and identify areas where potential customers lose momentum. Speed often separates average teams from high performers.
Multi-Touchpoint Engagement
Modern buyers require multiple touchpoints before the final purchase. Research suggests B2B buyers interact with 8 to 10 touchpoints during the buyer journey.
Consistent outreach across email, calls, content, and review sites increases higher conversion rates. Relevant content and targeted advertising strengthen engagement. Sales data shows that coordinated sales and marketing efforts produce a 65% higher pipeline conversion impact than cold outreach alone.
Data Driven Decision Making
Sales conversion improves when decisions rely on accurate sales data. Companies that use analytics are 23 times more likely to acquire customers and 19 times more likely to achieve profitability.
Sales analytics software provides AI powered insights into funnel performance and win rate trends. Sales managers can compare results against industry benchmarks and adjust marketing strategies or sales efforts to increase total revenue and higher conversion outcomes.
How To Improve Sales Conversion Rate
Improving your sales conversion rate requires targeted strategies that address specific points in the buyer trip. These proven tactics help sales teams convert more qualified leads without adding pressure to lead generation strategies.
Personalize Your Sales Outreach And Messaging
Generic messages don't work anymore. Decision-makers receive tons of messages every day. Personalized outreach emails receive around 32.7% more replies than non-personalized messages. This improves conversion rates from email to conversation and ended up in the pipeline.
Segment your audience based on industry, company size, or specific pain points. Sales reps should research companies before reaching out and understand their challenges. Potential customers are more likely to open it, read it, and respond when your message feels tailored to your target audience. Analytical personalization can increase marketing effectiveness by up to 80%.
Optimize Your Sales Qualification Process
Your sales team wastes time on prospects with little chance of converting. Proper qualification makes sales reps focus on the right buyers. Conversion rates vary by industry and channel, but your sales and marketing efforts should want a little over 1 SQL for every 10 MQLs generated as a starting point.
Frameworks like BANT help assess budget, authority, need, and timeline. Then implement lead scoring systems that assign values based on prospect behavior. Research shows 82% of top-performing reps always research their prospects before reaching out. Speed matters too. Responding within 5 minutes makes you 21 times more likely to qualify your lead versus waiting 30 minutes.
Improve Lead Nurturing And Follow-Up
A shocking 80 percent of new leads never convert into sales. Lead nurturing addresses this gap by building relationships at every sales stage. Email outreach campaigns with follow-ups get 3.2x more replies than those without.
Personalized follow-up emails that provide relevant content based on where prospects are in their customer trip should be sent. Nurture campaigns that lead the industry generate 50 percent more sales-ready leads at a 33 percent lower cost. Lead nurturing emails get 4 to 10 times the response rate compared to standalone email blasts.
Use Social Proof And Customer Testimonials
Nearly all customers read reviews before making a purchase online. At least one survey shows the percentage that do is 99.9%, while other data suggests 70%. Positive reviews and testimonials increase brand trust among 72% of consumers.
Customer testimonials should be showcased on your website, product pages, and emails. Case studies provide detailed proof of how your product affected customer success. Seven out of 10 consumers trust an influencer's recommendations. Then 66% of consumers say influencers have sway over their purchase decisions.
Streamline Your Sales Process And Remove Barriers
Friction points affect your final purchase rate. According to research, 22% of customers abandon their purchase because the checkout process was too long or complicated. Sales process bottlenecks can reduce your team's capacity to close deals by 20-30%.
Map your processes from lead response to deal close. Look for bottlenecks where deals slow down. The sales funnel should be simplified by reducing steps required to make a purchase. You accelerate decision-making and reduce hesitation when prospects face fewer hurdles related to cost, time, or complexity.
Advanced tactics separate high-performing sales teams from those struggling with conversion performance. These strategies require technology investment and process maturity, but they deliver measurable improvements to your sales conversion rate.
Map Content And Sales Plays To Buyer Signals
Signal-based timing determines when to participate with each account, turning static lists into dynamic chances. Teams acting on intent signals within 24 hours see a 29% lift in creating chances versus slower responders.
Your content strategy should arrange with specific buyer signals at each funnel stage. AI classifies content assets by buyer experience stage and ensures the right materials surface at the right moment. Sales teams receive just-in-time content recommendations tied to live buying signals instead of searching for assets.
High-intent signals demand immediate action. New executive hires in your buyer's function, public RFP mentions and significant funding events require response within 48 hours. Each signal type maps to specific sales plays and content that matches buyer readiness.
Create AI-Assisted Coaching And Feedback Loops
AI-powered feedback scores and analyzes every sales call, then delivers coaching recommendations that are customized and up-to-the-minute. New reps get feedback after every call, helping them improve faster without needing a manager on every conversation.
Organizations using conversational intelligence achieve 12% higher win rates compared to traditional coaching alone. The system delivers immediate, call-specific feedback to new reps and reduces ramp time by up to 40%.
Reps can rate their feedback and leave comments, creating a two-way coaching loop that increases participation. AI pinpoints where reps struggle like discovery or objection handling, so coaching becomes focused and practical.
Implement Account-Based Selling Strategies
About 48% of organizations using an account-based strategy see higher average win rates. Deals with 3 or more stakeholders who are engaged close at 2x the rate of single-threaded deals.
Multi-thread from day one rather than waiting for your first contact to go silent. Start with 3 to 5 contacts at the same time across the buying committee. Organizations report that account-based strategy delivers better return on investment in roughly 89% of cases.
Build Digital Sales Rooms For Better Participation
Digital sales rooms centralize content, communications and collaboration for buyers and sellers throughout the deal cycle. Up-to-the-minute buyer metrics show who interacts with content and when, helping sellers track buyer intent and prioritize follow-up actions.
DSRs shorten sales cycles by creating a single contact point that increases communication speed. Buyers access information without searching through emails or waiting for sales team responses.
Make Use Of Information To Tailor Every Buyer Interaction
About four-fifths of customers tell us they are comfortable with customized experiences, and a large majority expect companies to do it. Offers that are customized generate three times higher ROI than mass promotions.
Using personalization in customer interactions can increase conversion and cross-sell rates by 30% to 40%. Sales automation leaders boost revenues and reduce cost to serve, both by as much as 20%.
Tools And Technology For Sales Conversion Optimization
Modern sales conversion optimization depends on the right technology stack. Your sales team needs tools that track conversions, automate repetitive tasks, and deliver AI powered insights that improve sales performance.
CRM Systems For Tracking And Managing Conversions
A customer relationship management system brings everything together. Your sales, service, marketing, and commerce data all live in one place. An AI-powered CRM creates a single source of truth that keeps your entire team in sync. You waste time tracking down information without a CRM. A CRM must have several key features.
AI CRM analyzes your prospects' behavior like website visits, email engagement, and demo requests, then ranks leads based on their likelihood to convert. AI CRM can assign points to leads based on actions like email opens or website visits. Lead scores adjust with AI-powered analytics that factor in frequency and recency of interactions.
Sales Enablement Platforms For Rep Performance
Sales enablement software helps salespeople train, receive coaching, and find the sales materials they need to serve their leads. The best platforms use AI to figure out the context of sales conversations and surface relevant articles, videos, and more that sales reps might need. AI makes sales enablement smarter by recommending the right content, analyzing sales calls to highlight what works, and suggesting next steps based on data.
AI-Powered Analytics And Predictive Insights
AI-powered analytics track your customer behavior, sales performance, and revenue trends immediately. Sales teams using intelligent capabilities experience 10.5 times more positive effect on forecasting accuracy, according to Salesforce. Teams using AI sales features see a 48% decrease in average time to close.
Sales Automation Tools To Increase Efficiency
Sales automation handles repetitive tasks that eat up your time. Sales automation tools can handle more than 30% of sales-related activities. High-performing sales reps spend 20 to 25% more time with customers than lower-performing reps. Companies that implement automation generate around 16% more leads compared to those using no automation.
How To Measure And Track Your Conversion Performance
Tracking sales conversion rate requires focusing on metrics that reveal both pipeline health and revenue potential. Sales activity metrics are quantifiable data points used to measure sales performance of individual reps and teams. These metrics show how well a sales strategy works and identify areas to improve.
Essential Sales Conversion Metrics To Monitor
Sales performance tracking works best when you focus on metrics that guide next actions. Activity metrics include number of cold calls, meetings booked and follow-up rate. Conversion metrics track lead to opportunity rates and win rate. Revenue metrics measure quota attainment, average deal size and customer lifetime value. Efficiency metrics reveal customer acquisition cost and sales cycle length.
Building Dashboards For Up-To-The-Minute Visibility
A sales dashboard is a visual representation of sales metrics located within your CRM. Sales dashboards provide up-to-the-minute data and insights that help managers identify bottlenecks and coach reps on specific weaknesses. The most effective sales dashboards translate raw numbers into meaningful signals. Research shows that 75% of business leaders report performance improvements from analytics-based decision-making.
Comparing Your Performance Against Industry Standards
Sales comparison is a process businesses use to gain or maintain a competitive edge. Comparing helps identify issues and why they happen. You can use sales comparison data to measure your sales performance against the industry standard.
Using Data To Optimize Continuous Improvement
Informed businesses are 23 times more likely to acquire customers and 19 times more likely to be profitable. McKinsey reports that companies exploiting sales analytics have seen revenue increases within months.
How Gain.io Improves Sales Conversion Rate
Gain.io is an all-in-one CRM designed to help modern sales teams grow revenue and close more deals with fewer tools. It brings all contacts, leads, deals, and communication into one unified dashboard. No more scattered spreadsheets or forgotten follow-ups. That clarity helps improve conversion rates and gives your sales team better visibility into the entire sales funnel.
Gain.io enables automation of follow-ups, visual pipeline tracking, and smart task management so sales reps focus on high-impact conversations. The platform’s clean interface and no-code automation make it easy for teams to stay aligned and track every interaction across the buyer journey. With seamless integration and real-time engagement insights, Gain.io supports higher conversion performance from first contact to final purchase. You can enjoy Gain.io at a suitable price.
FAQs
What Is A Good Sales Conversion Rate For B2B SaaS Companies?
A good sales conversion rate for B2B SaaS typically ranges between 15% and 30% at the opportunity stage. However, the average conversion rate varies by deal complexity, sales cycle length, and lead quality. Industry benchmarks help sales leaders set realistic targets based on funnel performance.
Can Sales Conversion Rate Impact Customer Acquisition Cost?
Yes, the sales conversion rate has a direct impact on customer acquisition cost. Higher conversion rates mean more paying customers from the same number of qualified leads. Strong sales performance reduces wasted sales efforts and improves total revenue efficiency.
Does Lead Source Affect Sales Conversion Rates?
Yes, lead source significantly affects conversion rates. SEO and referral leads often show higher conversion than cold outreach or paid ads. Sales data reveals that high-intent potential customers convert faster across multiple touchpoints in the buyer journey.
How Does Average Deal Size Influence Conversion Performance?
Larger average deal size often increases deal complexity and extends the sales process. Enterprise sales teams may see lower conversion rates but higher total revenue per deal. Sales managers must balance win rate and revenue goals across different industries.
Is Sales Conversion Rate The Same As Win Rate?
No, sales conversion rate and win rate are not identical. Sales conversion can apply to any sales stage, such as lead conversion rate or SQL to opportunity. Win rate typically measures opportunity to closed deal performance.
Can CRM Data Improve Sales Conversion Rate?
Yes, accurate CRM data improves sales conversion performance. Clean sales dashboards help sales managers identify areas where potential buyers drop off. AI-powered insights also highlight gaps in the sales funnel and optimize sales efforts.
Why Do Some Teams Experience Lower Conversion Rates Despite High Lead Volume?
High lead volume does not guarantee higher conversion. Poor lead quality, weak sales and marketing alignment, or friction in the buying journey reduce conversion performance. Sales leaders must evaluate funnel performance and focus on qualified leads rather than raw total number.
Picture this scenario: your B2B SaaS team in 2025 is flooded with demo requests. The inbound engine is humming. Marketing celebrates another record month. But when you check the numbers, only a small fraction of those demos progress to a second meeting. Fewer still become real opportunities. Sound familiar?
Here is the core problem. Sales and marketing efforts generate more leads than ever, yet win rates stay flat. Teams chase volume instead of pursuing leads that fit and convert. The result? Wasted sales capacity, frustrated reps, and forecasts that never quite hold up.
Lead qualification is the process of deciding which leads deserve deeper sales effort based on fit, intent, and timing. It answers a simple question: should we invest real selling time in this prospect right now?
The stakes are higher than they have ever been. Average buying groups now include 6-10 people, and sales reps spend less than one-third of their week in actual selling activities. Everything else gets eaten by admin, research, and chasing prospects who were never going to buy. That makes qualification non-negotiable for any team serious about hitting revenue targets.
This article covers what lead qualification means today, the key types of qualified leads, practical frameworks you can apply immediately, a step-by-step lead qualification process you can roll out this quarter, common mistakes that hurt conversions, best practices to improve accuracy, and how Gain.io helps you see buying intent through content collaboration.
What Is Lead Qualification
Lead qualification is evaluating a prospect against your ideal customer profile, buying intent, and readiness to decide whether they move deeper into your sales process. It functions as a gatekeeping mechanism that keeps low-fit leads out of the pipeline while accelerating high-fit ones through to close.
Think of it this way: lead generation fills the funnel. Lead qualification filters and prioritizes that funnel so your sales reps spend time on deals worth pursuing.
In a modern B2B motion, qualification starts the moment a form is submitted or a trial is created. It continues through discovery calls, demos, and proposal stages. This is not a single checkpoint. It is an ongoing evaluation that happens at every stage of the sales cycle.
Three practical pillars define effective qualification. Fit covers whether the prospect matches your target industry, company size, tech stack, and region. Intent reflects their behavior, engagement signals, and internal urgency to solve a problem. Timing looks at budget cycles, project deadlines, and whether they need to act now or in six months.
Here is a real-world example. A marketing agency qualifies a lead from a January 2025 webinar. The company has 200 employees, a CMO attended the session, they visited the pricing page three times in a week, and they mentioned urgency to replace their current vendor by Q3 2025. That combination of fit, intent, and timing signals a lead worth pursuing immediately.
Why Lead Qualification Matters For Modern B2B Teams
In 2025-2026, customer acquisition cost is rising, inbound is noisier, and outbound reply rates continue to decline. Every sales hour must point at the right accounts. Chasing unqualified leads burns budget and demoralizes your team. Let me break down why lead qualification helps teams win more deals with less wasted effort.
Higher Conversion Rates. Sales reps who consistently work well-qualified opportunities close far more deals from fewer conversations. Teams with a strong lead qualification process typically see conversion improvements in the 20-40% range. That is not marginal. That is the difference between hitting quota and missing by a mile.
Shorter Sales Cycles. Weeding out poor-fit leads early reduces no-decision outcomes and repeated demos for the wrong buyers. When your pipeline is filled with potential customers who have real budget, authority, and urgency, deals close faster. This matters especially in complex sales cycles that often stretch 6-9 months.
Better Forecasting. When your sales pipeline contains leads that passed consistent qualification checks, win-rate assumptions and revenue projections become reliable. Your Q4 2025 forecast holds up because you know the quality of what sits in your pipeline.
Stronger Sales And Marketing Alignment. Shared qualification rules and clear definitions for marketing qualified leads MQLs, sales accepted leads, and sales qualified leads SQLs reduce friction over lead quality. Marketing teams can refine campaigns based on closed-won data instead of guessing. Sales and marketing teams finally speak the same language.
Common Types Of Qualified Leads
Why does naming different lead types matter? It gives sales and marketing a shared map of where a prospect is on their journey. Without clear definitions, handoffs become messy, accountability disappears, and promising leads fall through the cracks.
Four core types define the modern B2B qualification landscape: Marketing Qualified Leads, Sales Accepted Leads, Sales Qualified Leads, and Product Qualified Leads.
These definitions should be tailored by each company but must be documented in your CRM and playbooks. When every rep handles leads consistently, pipeline accuracy improves dramatically.
Marketing Qualified Leads
Marketing qualified leads are prospects who match basic ideal customer criteria and have shown marketing engagement strong enough to deserve closer attention. They are not ready for full sales cycles yet, but they have raised their hand in some meaningful way.
What behaviors define an MQL in 2025 for a B2B SaaS company? Attending a live webinar signals active interest. Downloading a detailed guide or report shows research intent. Returning to the pricing page several times in a week suggests they are evaluating options. Subscribing with a corporate email and engaging with nurture emails indicates ongoing consideration.
Consider someone who signs up for a February 2025 “Content Approval Workflow” webinar and then views multiple case studies afterward. That pattern of engagement, combined with the right job title and company size, would trigger MQL status in most lead scoring models.
Marketing uses lead scoring and engagement data inside a CRM to promote contacts to MQL status. The threshold should be high enough to filter noise but low enough to capture leads generated with genuine interest.
Sales Accepted Leads
A sales accepted lead is an MQL that a sales rep or SDR has reviewed, agreed meets quality standards, and committed to working within a defined time frame. This intermediate stage creates a clear handoff moment between marketing and sales.
Why does this matter? Without an acceptance step, marketing sends leads over the wall and sales ignores them. With a sales accepted lead stage, there is a documented “yes, we own this” moment. Accountability is clear.
Practical acceptance criteria might include correct region, company size within target band, and a confirmed email or LinkedIn presence for the primary contact. SDRs typically review new MQLs in daily or weekly queues. They accept leads that meet criteria, request enrichment for promising but incomplete records, or recycle poor-fit leads back to nurturing.
Sales Qualified Leads
Sales qualified leads SQLs have passed discovery, shown a clear problem your product can solve, and have confirmed or probable budget, authority, and timeframe. These are the leads your sales representative should prioritize.
Signals that a lead has reached SQL status include requesting a demo, inviting multiple stakeholders to a call, or sharing internal deadlines like “we need a solution live before September 2025.” These behaviors indicate real buying intent, not just curiosity.
SQLs typically trigger opportunity creation in the CRM and enter formal forecast and pipeline reports. Your qualification criteria should be strict enough that a meaningful percentage of SQLs become real opportunities, but not so strict that reps miss promising leads earlier in the sales process.
Product Qualified Lead
A product qualified lead is a user who has already touched your product through a free trial, freemium plan, or sandbox environment and reached specific usage thresholds that suggest readiness to buy.
For a collaboration platform like Gain.io, concrete PQL criteria might include a workspace owner inviting three or more colleagues, approving multiple pieces of content in a week, or integrating with another tool like Slack within the first 14 days.
Product analytics in 2024-2026 make it feasible to trigger sales outreach the moment usage hints at a buying conversation. You do not have to wait for form fills or demo requests. The product usage data tells you who is engaged.
PQLs often close faster than MQLs because they have already experienced real value. The buying decision becomes easier when a prospect has seen your product solve their problem firsthand.
Lead Qualification Frameworks You Can Use
Frameworks give your team structured question sets that help reps run consistent discovery rather than improvising on every call. Not every lead conversation follows the same path, but having a shared approach improves results.
No single lead qualification framework fits every team. Most B2B companies mix elements of several depending on deal size and complexity. A high-velocity inbound motion needs different questions than a complex enterprise sale with multiple stakeholders.
BANT Framework
BANT stands for Budget, Authority, Need, and Timeline. Each dimension covers a critical aspect of qualification.
Budget asks whether the prospect has allocated funds or can secure them. Authority identifies who makes the buying decision and who influences it. Need confirms the prospect has a problem your product solves. Timeline establishes when they plan to make a decision.
Example questions a rep might use on a discovery call:
“How have you budgeted for content operations this year?”
“Who else will be involved in the final sign-off for a platform like this?”
“What happens if you do not solve this problem by Q3?”
BANT works well for shorter sales cycles and inbound leads where you need to qualify quickly. Trial signups from Q1 2025 campaigns are good candidates for BANT qualification.
The limitation is that BANT can feel too vendor-centric if reps lead with budget and timeline before understanding the prospect’s pain points. Smart reps adapt the order based on the conversation flow.
CHAMP Framework
CHAMP stands for Challenges, Authority, Money, and Prioritization. The key difference from BANT is that CHAMP starts from the prospect’s problems rather than your solution.
Example prompts for CHAMP discovery:
“What is the hardest part of getting content approved across all your clients?”
“Where does this project sit among your team’s top priorities for 2025?”
“Walk me through what happens when an approval gets stuck.”
CHAMP works well in consultative sales where reps act as advisors and often need multiple conversations to shape a project. It blends well with account-based motions where you target a small number of high-value accounts and invest time in deeper discovery.
The framework is sometimes called CHAMP Challenges Authority Money Prioritization in full documentation.
MEDDIC Framework
MEDDIC stands for Metrics, Economic Buyer, Decision Criteria, Decision Process, Identify Pain, and Champion. Some teams use variants like MEDDPIC that include Paper Process for contract and procurement steps.
MEDDIC is typically used for enterprise sales with multiple departments, legal review, security assessments, and longer sales cycles running six months or longer.
For a collaboration platform sale, identifying metrics might focus on “time to approve campaigns” or “number of revision cycles per asset” as the core before-and-after story. The decision process identifies how the buying committee evaluates options and what decision criteria they use.
The framework is sometimes referenced as MEDDIC Metrics Economic Buyer Decision Criteria Decision Process, and Identify Pain Champion in sales training materials.
Reps gradually fill in each MEDDIC component over several calls and emails. You cannot ask everything on a first discovery call without overwhelming the prospect.
Step By Step Lead Qualification Process
While every company’s stages differ, the most effective qualification processes cover a repeatable set of steps from first touch through opportunity creation and beyond. Here is a practical seven-step flow that a B2B team could implement in their CRM and playbooks within a quarter.
Use this lead qualifying process to train new SDRs and AEs. Call recordings and examples from real deals in 2024-2025 bring each step to life.
Step One- Define Your Ideal Customer Profile
The lead qualification process starts by documenting your ideal customer based on your best customers over the past 12-24 months. Include revenue size, industry, region, tech stack, and buying committee structure.
Run a simple analysis: export closed-won deals from 2024, look at annual contract value, time to close, and retention. Identify common patterns among your strongest accounts. What do they share?
Create at least one negative ideal customer profile as well. Highlight company traits that tend to fail onboarding or churn quickly. Knowing who not to pursue saves as much time as knowing who to chase.
Keep the ICP short enough that sales reps can remember and use it on calls. A ten-page document that nobody reads is worthless.
Step Two- Set Lead Scoring And Qualification Criteria
Lead scoring criteria differentiate between fit scores and behavioral scores. Fit scores cover firmographic and demographic attributes like industry and company size. Behavioral scores track website visits, trial usage, email engagement, content approvals, and meeting attendance.
A simple scoring model might work like this:
Signal
Points
Job title: Head of Marketing
+20
Company size: 50-500 employees
+15
Attended product tour
+10
Viewed case studies multiple times
+10
Downloaded pricing guide
+15
Corporate email domain
+5
Set a threshold score that automatically promotes a record to MQL. For example, 40 points might be the cutoff.
Review and adjust scores quarterly. You will learn which traits correlate with deals that close as you gather more data.
Step- Three Capture And Enrich Lead Data
Leads enter your system through forms, chat, events, referrals, or product trials. Consistent lead capture into a CRM matters because it creates a single source of truth for your sales funnel.
Data enrichment tools automatically add details like industry, employee count, and tech stack based on a corporate email domain. This information helps SDRs have informed conversations in the first 24-48 hours after a hand-raiser action.
Validate critical fields like region and job title during the first live interaction. Enrichment data is useful but not always accurate. Trust but verify.
Step Four- Run Discovery And Apply Your Framework
The first substantial conversation is where reps apply frameworks like BANT or CHAMP. Whether it is a 20-minute discovery call or an in-depth demo, this step separates high quality leads from the rest.
A good discovery call includes a clear agenda, thoughtful open-ended questions, and space for the buyer to explain their current workflow and constraints.
Example questions tailored to collaborative content workflows:
“Walk me through how your team gets campaign assets from first draft to final approval today.”
“What happens when revisions pile up and deadlines get tight?”
By the end of this step, reps should have enough information to decide if the lead is a true opportunity, needs nurturing, or should be politely disqualified. The goal is to identify pain points clearly and assess buying intent honestly.
Step Five- Prioritize And Route Leads
Qualified leads should be prioritized in queues based on score, urgency, and strategic value. The order they appeared is not enough information to prioritize leads effectively.
Routing rules might send high-value accounts in North America to specific AEs or route PQLs to a specialized team trained on trial-to-paid conversions.
Set service-level expectations. New SQLs should be contacted within a specific number of business hours to keep momentum high. Document routing rules in a shared playbook and review with sales operations at least twice a year.
Step Six- Requalify Throughout The Deal Cycle
Qualification is not a one-time gate at the top of the funnel. Budgets can be frozen. Sponsors can leave. Priorities shift during a multi-month sales cycle.
Reps should revisit key questions about budget, authority, and timing at milestones like proposal delivery, security review, or contract redlining. This ongoing assessment keeps the decision process visible.
Requalification triggers include stalled approval workflows, long gaps in communication, or last-minute scope changes. Honest requalification can lead to either progressing the opportunity with confidence or mutually agreeing to revisit later instead of dragging dead deals through your forecast.
Step Seven- Learn From Closed Won And Closed Lost Deals
After opportunities close, teams should review why they won or lost and update qualification criteria based on these insights.
Run monthly win-loss sessions where AEs share patterns. What were common reasons for “no decision” in late 2024? What objections came up in specific industries? This analysis feeds back into ICP definitions, lead scoring process, and discovery questions.
The feedback loop becomes more powerful when combined with structured data from tools that track engagement on shared content and approvals. Understanding what worked helps you score leads based on signals that predict sales success.
Common Lead Qualification Mistakes That Hurt Conversions
Even teams with solid processes make qualification errors that hurt conversion rates. Recognizing these mistakes helps you avoid wasting time on low quality leads and missing promising leads that deserve attention. Research shows that companies lose up to 80% of leads generated due to poor qualification and follow-up practices.
Chasing Unqualified Prospects
One of the most expensive mistakes sales teams make is pursuing leads that were never a good fit. Studies indicate that 61% of B2B marketers send all leads directly to sales, yet only 27% of those leads turn out to be qualified. Sales reps spending time on unqualified leads cannot focus on prospects worth pursuing. The result is bloated pipelines, frustrated reps, and missed quotas. Before investing discovery time, verify that the lead meets basic fit criteria around company size, industry, and decision-making authority.
Ignoring Behavioral And Intent Data
Demographic data alone does not tell you whether a prospect is ready to buy. Engagement signals like pricing page visits, content downloads, and email interactions reveal intent. Companies that use behavioral data in qualification see 9% higher sales win rates on average. Ignoring these signals means you might prioritize a cold lead with the right job title over a warm lead showing clear buying behavior. Your lead scoring model should weight actions, not just attributes.
Delayed Lead Follow Up
Speed matters in the lead generation process. Research shows that responding to leads within five minutes makes you 21 times more likely to qualify them compared to waiting 30 minutes. Yet the average B2B company takes 42 hours to respond to a new lead. By then, prospects have moved on to competitors or lost their initial urgency. Build routing rules that get high-scoring leads to reps immediately, and set clear SLAs for response times.
Lack Of Alignment Between Teams
When sales and marketing teams disagree on what makes a qualified lead, friction multiplies. Marketing celebrates MQL volume while sales complains about lead quality. Studies show that companies with strong sales and marketing alignment achieve 38% higher sales win rates. The fix is simple but requires discipline: document shared definitions for MQL, SAL, and SQL, and review them quarterly with both teams present.
Poor Lead Documentation Practices
Without proper documentation, valuable qualification insights disappear. When a rep leaves or hands off a deal, the next person starts from scratch. CRM data shows that incomplete lead records correlate with 23% longer sales cycles. Every discovery call should result in updated notes capturing budget discussions, stakeholder names, timeline expectations, and identified pain points. Lead qualification tools integrated with your CRM make this documentation automatic rather than optional.
Best Practices To Improve Lead Qualification Accuracy
Avoiding mistakes is the first step. Building a systematic approach to scoring leads and identifying the most promising leads requires deliberate practices. Here is how to strengthen your lead qualification efforts with methods that actually improve accuracy.
Define Clear Qualification Criteria
Start with specific, documented criteria that every rep can apply consistently. Vague standards like “seems interested” lead to inconsistent results. Effective qualification criteria include firmographic requirements like minimum company size and target industries, behavioral thresholds like engagement signals, and discovery requirements like confirmed budget range and identified champion. Companies with documented qualification criteria report 30% higher forecast accuracy because their pipelines contain consistently evaluated opportunities.
Use Data Driven Lead Scoring
Predictive lead scoring removes guesswork from prioritization. Instead of relying on gut instinct, use historical data to identify which attributes and behaviors correlate with closed deals. Marketing automation platforms can assign point values automatically based on actions like demo requests, content engagement, and website visits. Companies using data-driven lead scoring see 77% higher lead generation ROI because they focus effort on high-probability opportunities.
Automate Lead Tracking Workflows
Manual tracking creates gaps where leads fall through the cracks. Automated workflows in your CRM can trigger tasks when leads reach score thresholds, alert reps when engagement signals spike, and route leads to the right owners based on territory or segment. This automation ensures that sales leadsget attention at the right moment. Teams with automated lead tracking report 14.5% shorter sales cycle length on average.
Maintain Continuous Sales Feedback Loops
Qualification is not a one-way process from marketing to sales. Sales reps provide essential feedback on which leads convert and which fall flat. Monthly reviews of closed-won and closed-lost deals reveal patterns that improve lead qualification questions and scoring weights. Companies that run regular feedback sessions between sales operations and marketing teams see 67% better lead quality over time.
Monitor Qualification Performance Metrics
What gets measured gets improved. Track metrics like MQL-to-SQL conversion rate, SQL-to-opportunity conversion rate, average deal size by lead source, and sales cycle length by qualification score. These numbers reveal where your qualification process identify pain points and where adjustments are needed. Set benchmarks and review monthly. Teams that monitor qualification performance systematically improve conversion rates by 20-25% within two quarters.
How Gain.io Strengthens Lead Qualification
Gain.io reveals how real buying teams work together on campaigns and content before they ever sign a contract. This collaboration behavior provides qualification and intent signals that traditional CRM data cannot capture.
Centralized content feedback and approvals inside Gain.io show who in a prospect’s organization is involved, how fast they move, and how invested they are in solving their marketing operations challenges. When a lead invites teammates, moves quickly through approval workflows, and engages deeply with your materials, you see genuine buying intent in action.
Consider this scenario: a brand team in April 2025 runs multiple campaigns through Gain.io during a trial. They invite legal, compliance, and regional marketers to collaborate. They consistently meet internal deadlines. They leave detailed feedback on shared assets. This behavior signals strong fit and urgency far better than a simple demo request form.
Gain.io data refines qualification in several meaningful ways. You can identify true champions based on who drives approvals and initiates collaboration. You can detect slow or stalled workflows that may signal low priority or internal roadblocks. You can see which content types resonate most with a buyer’s organization. You can spot expanding buying committees as more stakeholders join workspaces.
When marketing and sales both have access to this collaboration data, they align better on what “qualified” truly looks like for content-heavy teams. Instead of debating lead quality based on form fills and email opens, you see how prospects engage with the actual work they would do as customers.
Customer success starts with properly qualified customers. Gain.io gives you the signals to find them.
FAQs
What Is The Goal Of Lead Qualification In Sales?
The primary goal of lead qualification is to ensure sales teams spend time on prospects who fit your ideal customer profile and have genuine intent to purchase. This process filters out low-probability opportunities early, allowing reps to focus on deals worth pursuing. Effective qualification improves conversion rates, shortens sales cycles, and increases forecast reliability. Without qualification, teams waste resources generating leads that never convert.
How Do Sales Teams Identify Qualified Leads?
Sales teams identify qualified leads through a combination of fit assessment and intent signals. Fit factors include company size, industry, region, and job title of the contact. Intent signals come from behavioral data like website visits, content downloads, demo requests, and product usage. Discovery conversations verify budget, authority, need, and timeline. The process identify pain points that your product can solve and confirms the prospect’s decision making process.
Which Framework Works Best For Lead Qualification?
The best framework depends on your sales motion and deal complexity. BANT works well for high-velocity inbound sales with shorter sales cycles. CHAMP suits consultative sales where understanding challenges comes before discussing budget. MEDDIC fits enterprise sales with complex sales cycles involving a buying committee and longer evaluation periods. Most teams combine elements from multiple frameworks based on their specific needs.
How Often Should Lead Qualification Criteria Be Updated?
Teams should formally review lead scoring criteria and qualification rules at least once per quarter. Additionally, update criteria after major business changes like entering a new market, launching new products, or significant shifts in average deal size. Analyze closed-won and closed-lost deals from the past 3-6 months to identify which attributes and behaviors best predicted success, then adjust your model accordingly.
What Metrics Measure Lead Qualification Success?
Key metrics include MQL-to-SQL conversion rate, SQL-to-opportunity conversion rate, opportunity-to-close rate, average deal size by lead source, and sales cycle length segmented by qualification score. Track the percentage of unqualified leads that slip into the pipeline and time-to-first-contact for new leads. These measurements reveal whether your qualification process effectively separates high quality leads from poor-fit prospects.
Contains information related to marketing campaigns of the user. These are shared with Google AdWords / Google Ads when the Google Ads and Google Analytics accounts are linked together.
90 days
__utma
ID used to identify users and sessions
2 years after last activity
__utmt
Used to monitor number of Google Analytics server requests
10 minutes
__utmb
Used to distinguish new sessions and visits. This cookie is set when the GA.js javascript library is loaded and there is no existing __utmb cookie. The cookie is updated every time data is sent to the Google Analytics server.
30 minutes after last activity
__utmc
Used only with old Urchin versions of Google Analytics and not with GA.js. Was used to distinguish between new sessions and visits at the end of a session.
End of session (browser)
__utmz
Contains information about the traffic source or campaign that directed user to the website. The cookie is set when the GA.js javascript is loaded and updated when data is sent to the Google Anaytics server
6 months after last activity
__utmv
Contains custom information set by the web developer via the _setCustomVar method in Google Analytics. This cookie is updated every time new data is sent to the Google Analytics server.
2 years after last activity
__utmx
Used to determine whether a user is included in an A / B or Multivariate test.
18 months
_ga
ID used to identify users
2 years
_gali
Used by Google Analytics to determine which links on a page are being clicked
30 seconds
_ga_
ID used to identify users
2 years
_gid
ID used to identify users for 24 hours after last activity
24 hours
_gat
Used to monitor number of Google Analytics server requests when using Google Tag Manager
1 minute
PostHog is used to collect anonymous usage statistics and product interaction data to help improve website performance and user experience.